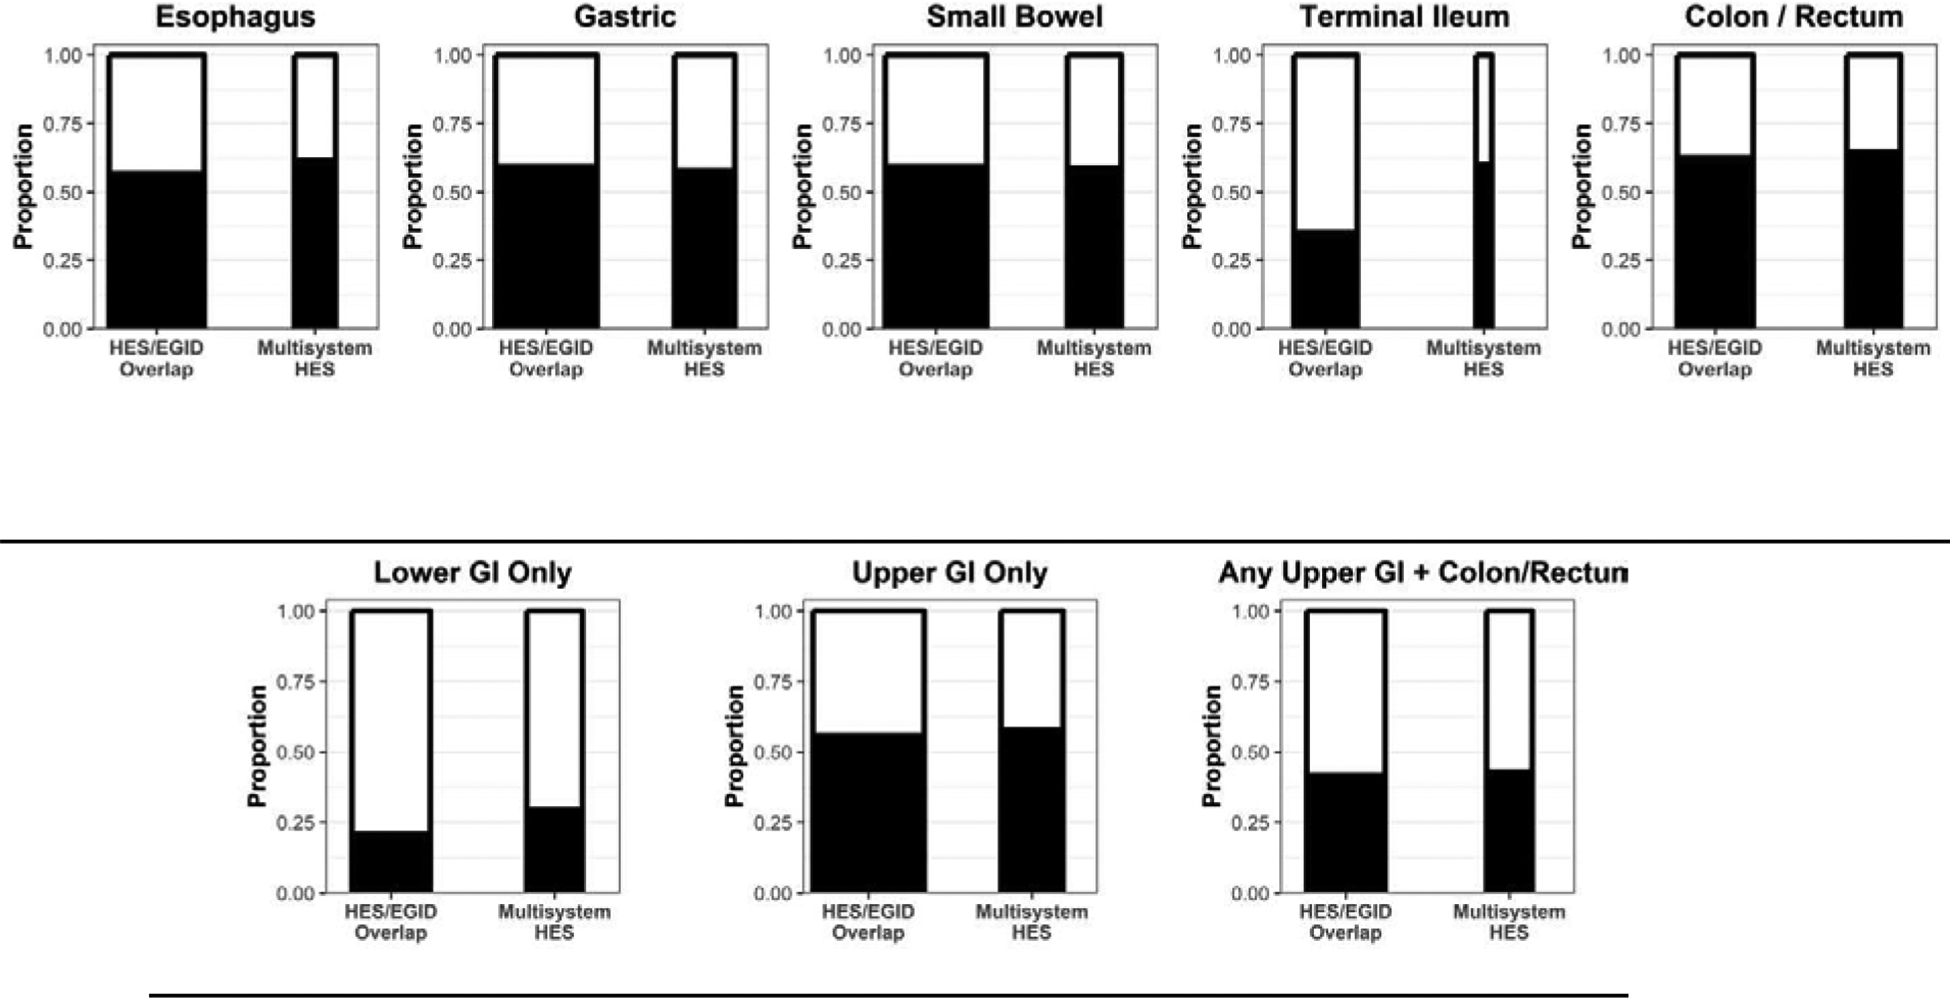
Figure 2B.

The height of the bar graphs indicates proportion of patients who had biopsies that met the inclusion cutoff in the indicated anatomic region (black) in each of the two cohorts (HES/EGID vs. Multisystem HES). The width of the bar is correlated with the number of patients who had biopsies in the indicated region. These groups are not mutually exclusive, ie. patients may be part of multiple groups. The categories “Lower GI only” and “Upper GI only” refer to observed positive biopsies in the respective region, meaning the denominator for the proportions includes patients that were not biopsied in the other region (i.e., not biopsied is interpreted as negative).
