
Figure 1. Microglia dynamically engage with myelin sheaths in the spinal cord.
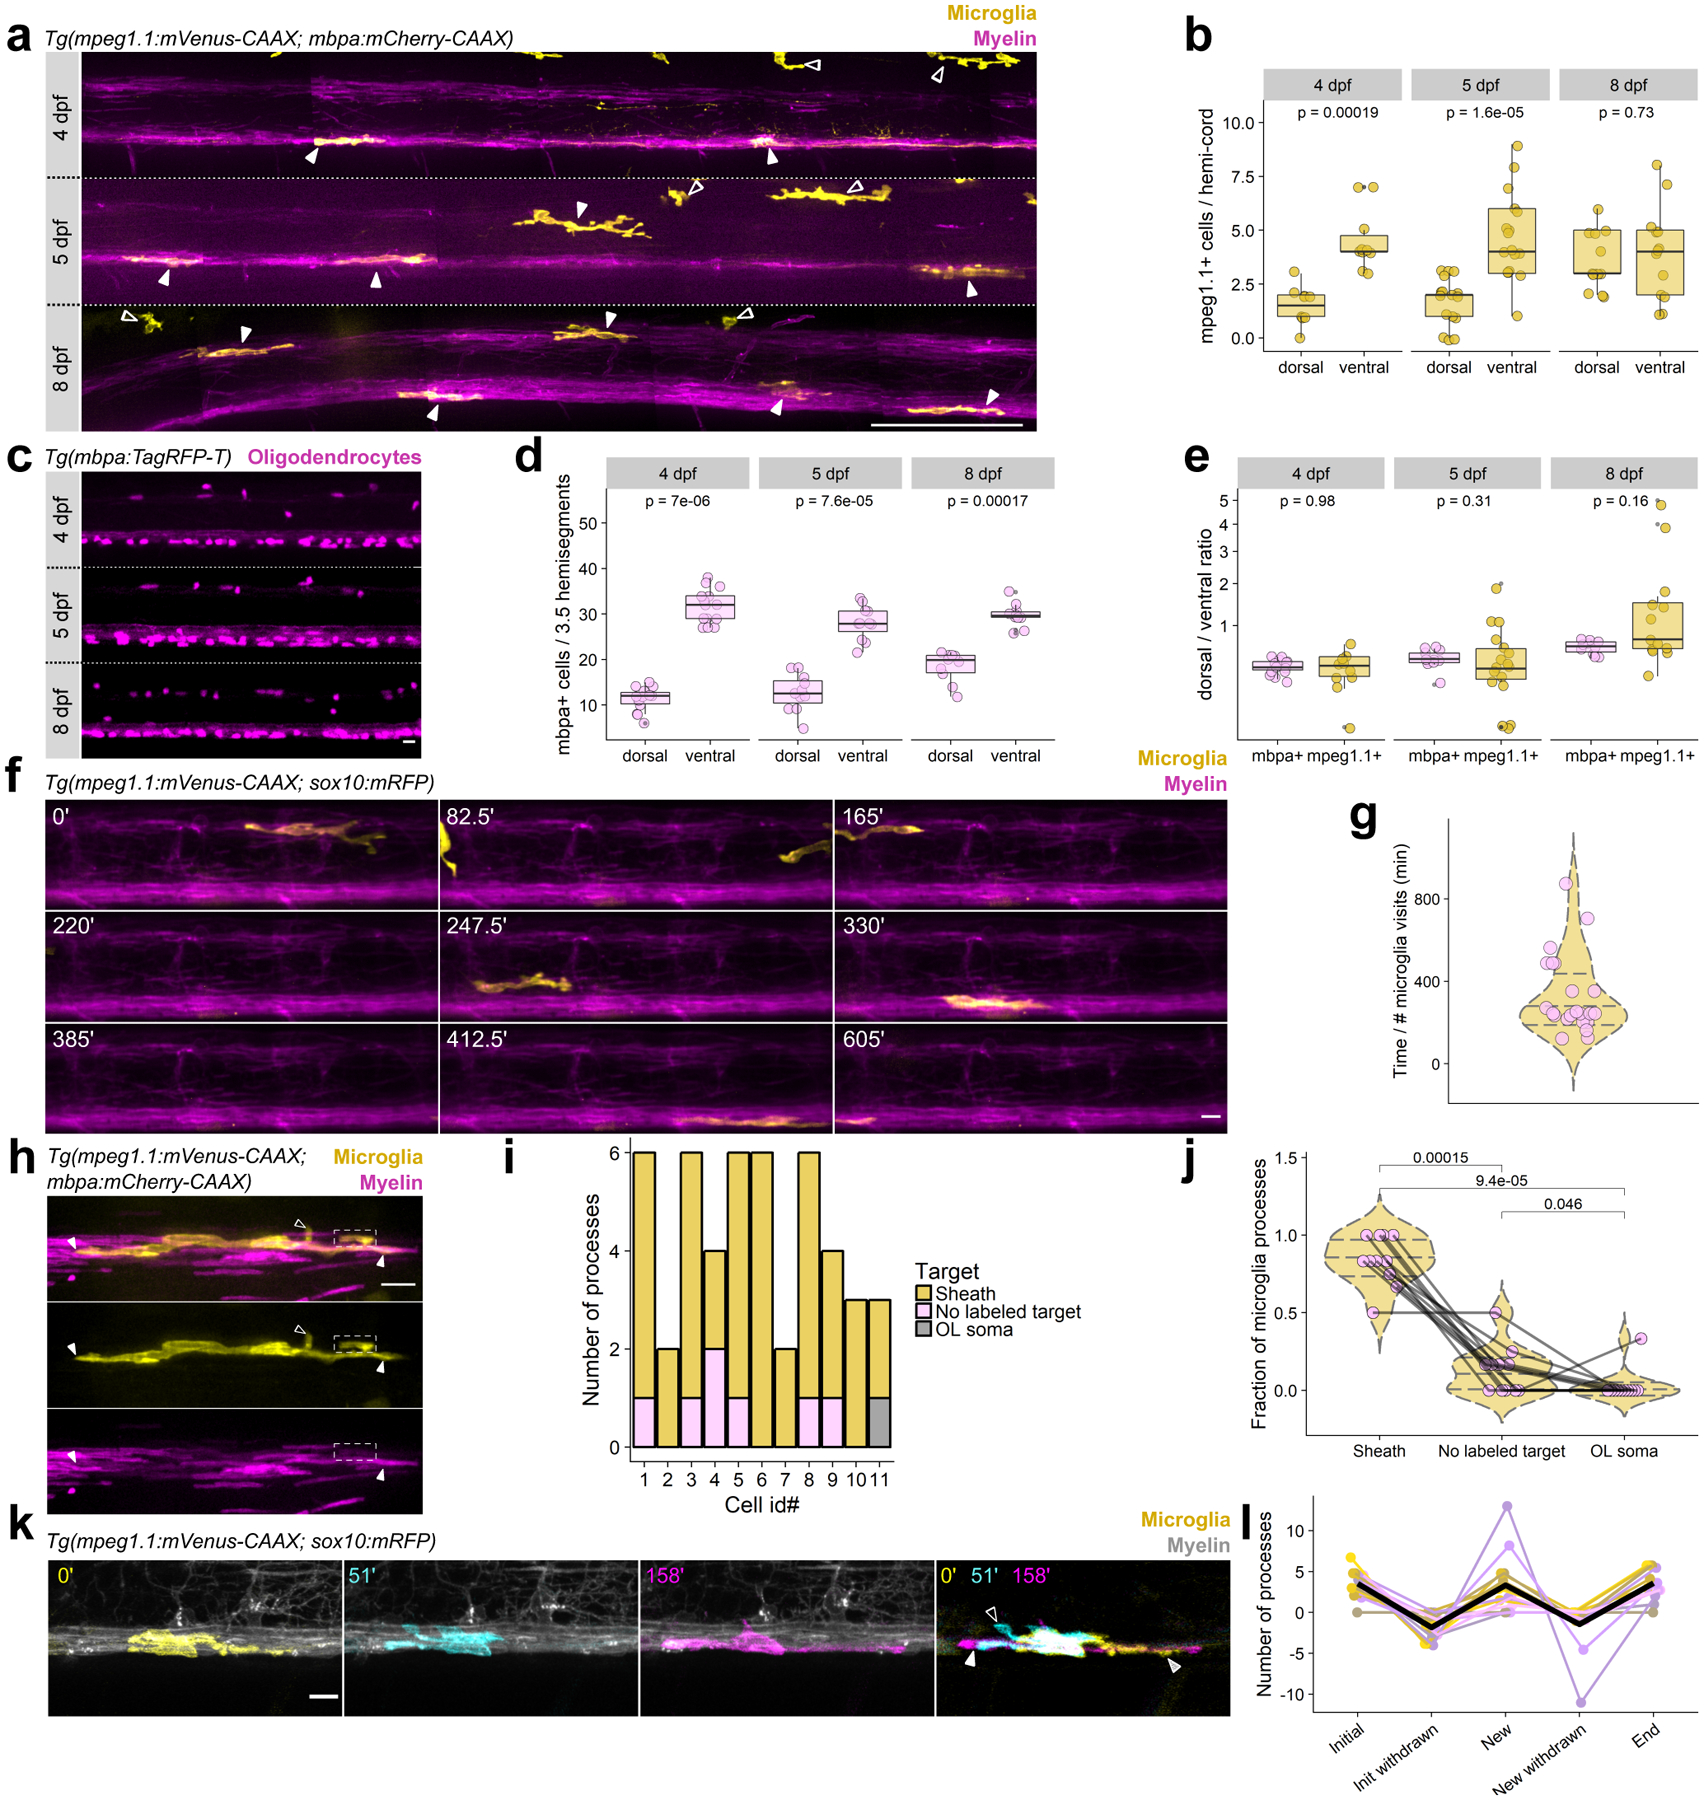
(a) Lateral tile scans of spinal cords of Tg(mpeg1.1:mVenus-CAAX; mbpa:mCherry-CAAX) larvae at 4, 5, and 8 dpf. Closed arrowheads mark microglia and open arrowheads mark peripheral macrophages. Scale bar, 50 μm. (b) Microglia counts in dorsal and ventral tracts (hemi-cord) in 4, 5, and 8 dpf larvae. Wilcox rank-sum test, n=fish/cells, n=10/60 4 dpf, 17/109 5 dpf, 13/97 8 dpf. (c) Oligodendrocytes in 3.5 hemisegments in the spinal cord of Tg(mbpa:TagRFP-T) larvae at 4, 5, and 8 dpf. Scale bar, 10 μm. (d) Oligodendrocyte counts in dorsal and ventral tracts (3.5 hemisegments) in 4, 5, and 8 dpf larvae. Wilcox rank-sum test, n=fish/cells, n=14/602 4 dpf, 11/448 5 dpf, 10/482 8 dpf. (e) Ratios of dorsal/ventral cell counts for mbpa+ oligodendrocytes and mpeg1.1+ microglia at 4, 5, and 8 dpf, for cells counted in (b) and (d). Data in (b), (d), and (e) analyzed by Wilcox rank-sum test. (f) Timelapse imaging frames over 10 h in Tg(mpeg1.1:mVenus-CAAX; sox10:mRFP) larvae at 4 dpf. (g) Time between microglia visits. Each point represents the timelapse acquisition time divided by the number of microglia visits to the imaging field of view; each point is one larva (n=22 larvae). Violin plot lines mark quantiles (25, 50, 75 percentile) and colors are meaningless. (h) A microglia (yellow) in the dorsal spinal cord of a Tg(mpeg1.1:mVenus-CAAX; mbpa:mCherry-CAAX) larva. Closed arrowheads mark close associations of microglial processes with myelin sheaths (magenta rectangles); open arrowheads mark processes extending toward unlabeled targets; dashed box shows a process enveloping a sheath. (i) Distribution of microglial processes per cell associated with myelin sheaths, oligodendrocyte somas, or unlabeled targets for n=11 cells (11 fish). (j) Fraction of microglial processes in (i) plotted per target type, Wilcox rank-sum test with Bonferroni-Holm correction for multiple comparisons. Each point represents one microglia. (k) Timelapse imaging frames of a microglia in a Tg(mpeg1.1:mVenus-CAAX; sox10:mRFP) larva, pseudocolored to show cell morphology at three different time points and merged. Striped arrowhead marks a process present at 0’ that is absent at 51’ (initial, withdrawn); open arrowhead marks a process generated during the imaging period that later disappears (new, withdrawn); closed arrowhead marks a process that is generated during the imaging period and is maintained at the end of the imaging window (new). (l) Number of processes generated and withdrawn by microglia during 1 hour of timelapse imaging; black trace is the mean (n=14 microglia in 14 fish). Scale bars, 10 μm.