
Figure 4. Neuronal activity regulates microglia-neuron interactions.
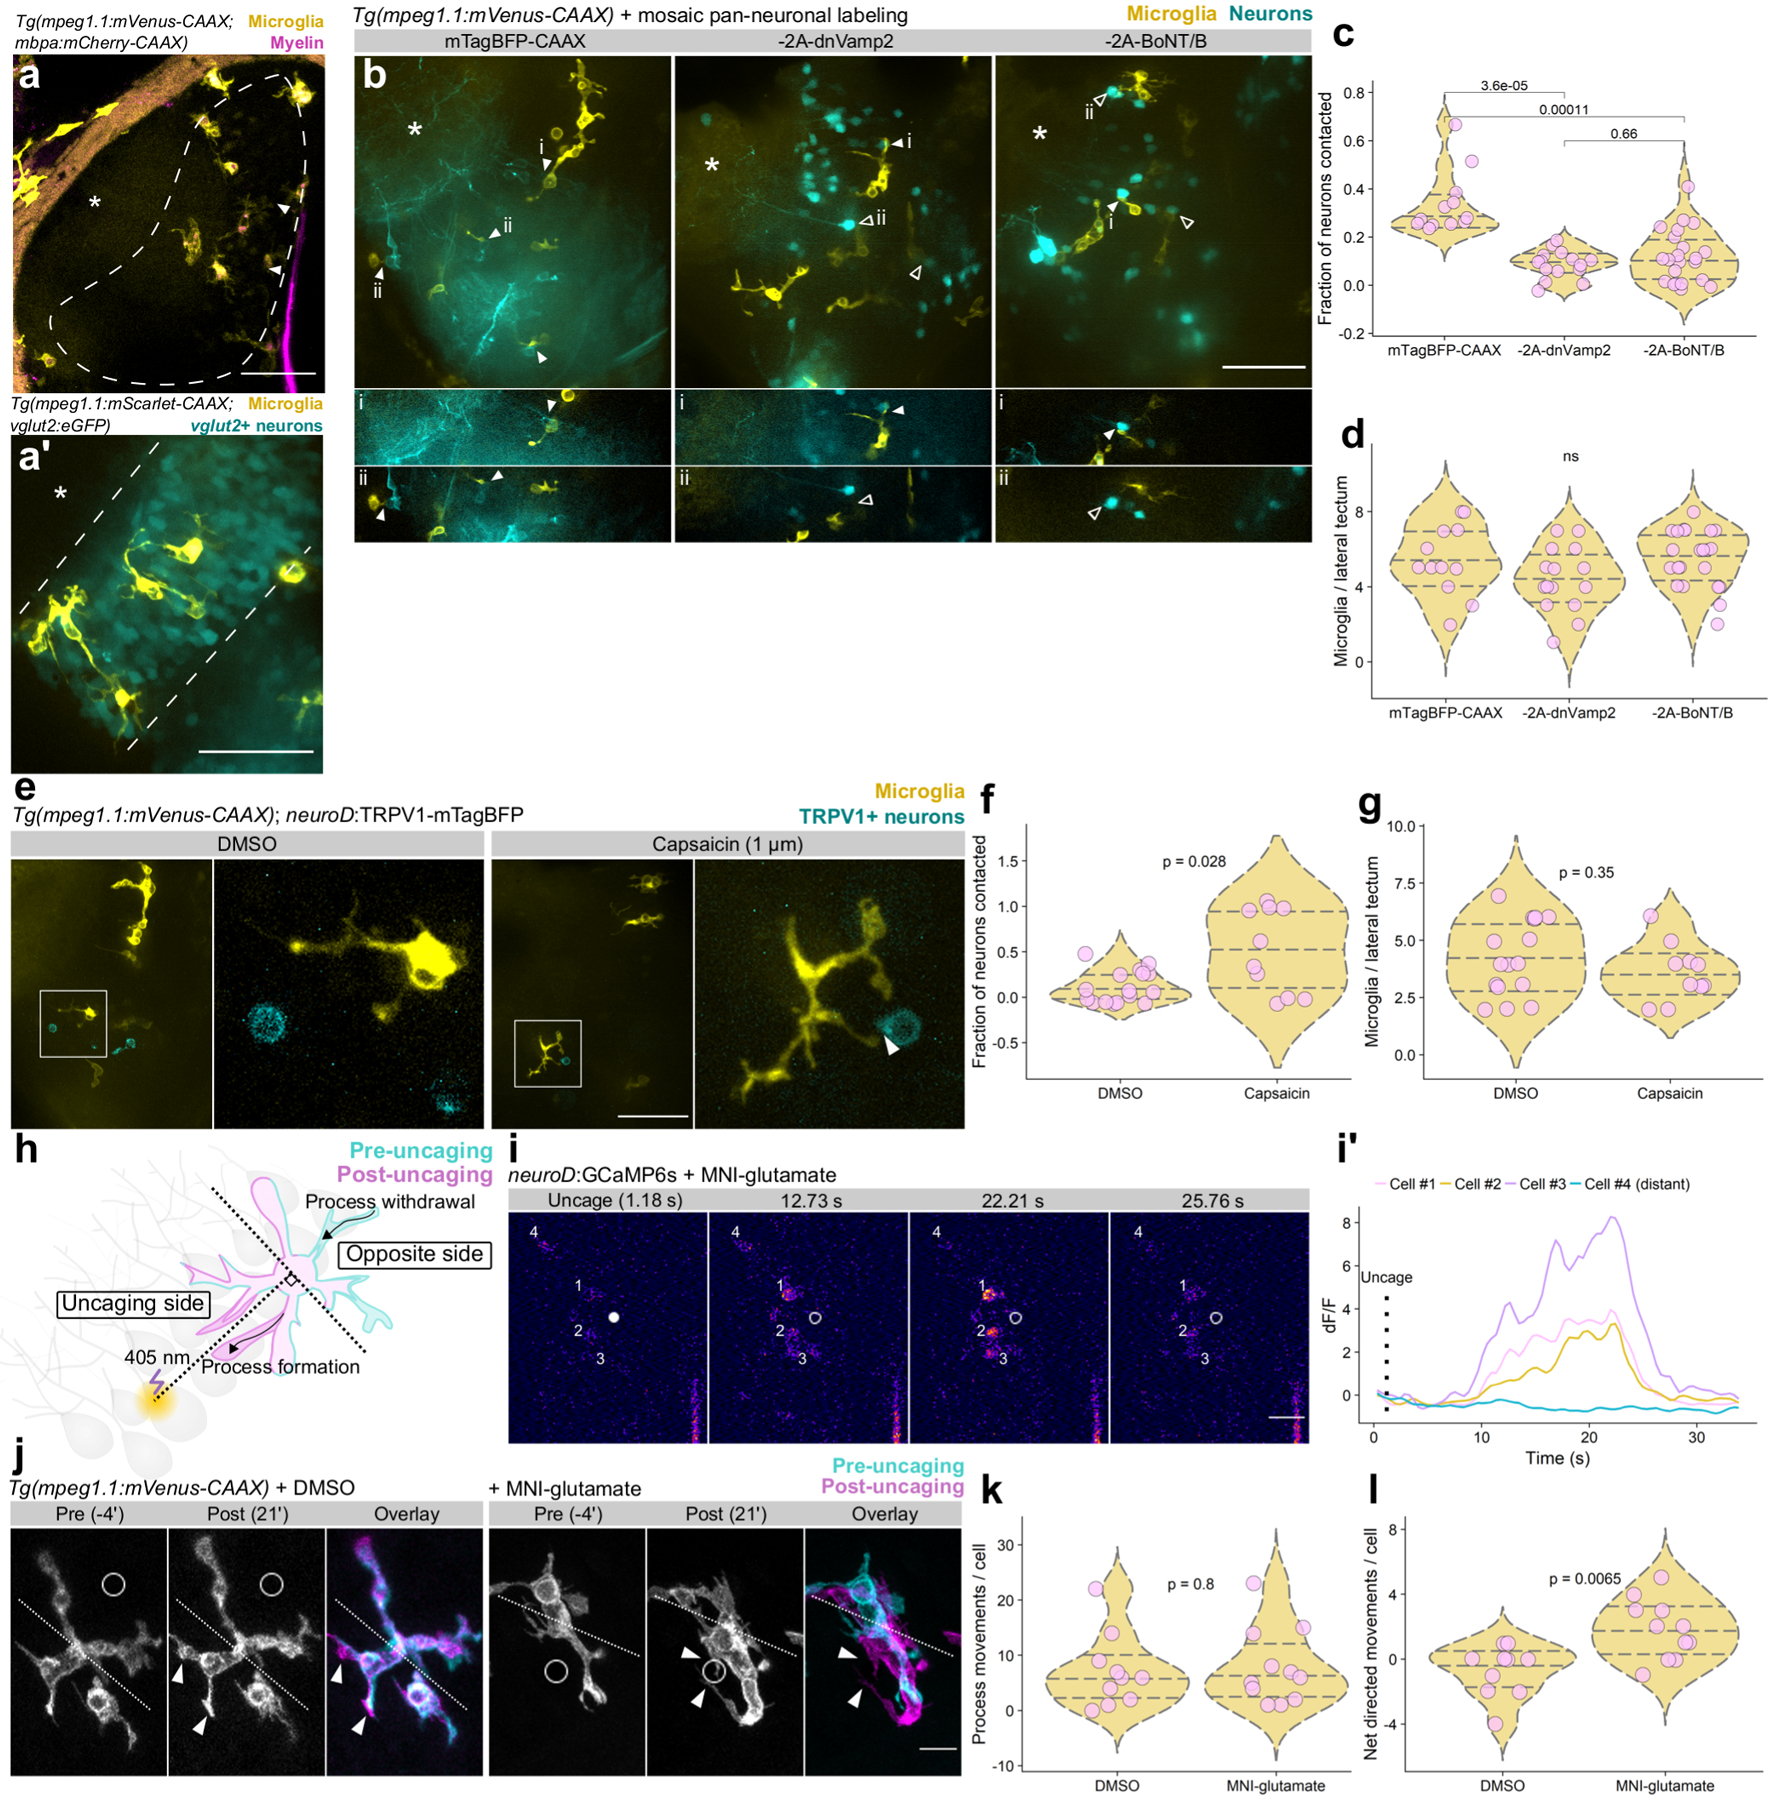
(a) Coronal view of microglia and myelin in one hemisphere of optic tectum in a live Tg(mpeg1.1:mVenus-CAAX; mbpa:mCherry-CAAX) 5 dpf larva. Dashed line marks the cell body layer, asterisks marks the neuropil layer, and arrowheads indicate the tectal commissure. (a’) Lateral view of microglia in the cell body layer. Microglia labeled by Tg(mpeg1.1:mScarlet-CAAX) and cell body layer glutamatergic neurons labeled by Tg(vglut2:eGFP). (a) and (a’) are representative images from 10 larvae. Scale bars, 50 μm. (b) Top panels, max projection images of optic tectum (lateral view) in Tg(mpeg1.1:mVenus-CAAX) larvae mosaically expressing neuroD:mTagBFP-CAAX or neuroD:mTagBFP-CAAX-2A-dnVamp2/BoNT/B (−2A-dnVamp2, −2A-BoNT/B). Panels below show single optical sections containing microglial-neuron contacts (closed arrowheads) or absence of contact (open arrowheads). Asterisks mark neuropil. Scale bar, 50 μm. (c) Fraction of neuron somas contacted per tectal field of view in each of the groups in (b), analyzed by Wilcox rank-sum test with Bonferroni-Holm correction for multiple comparisons. (d) Number of microglia per tectal field of view for each group in (b), analyzed by Kruskal-Wallis test. For (b-d), n=fish/neurons/microglia, n=12/166/65 mTagBFP-CAAX, 15/487/66 −2A-dnVamp2, 22/398/121 −2A-BoNT/B. (e) Max-projection images of microglia (yellow) and neurons sparsely expressing TRPV1-mTagBFP (cyan) in optic tectum of larvae treated with DMSO vehicle or 1 μm capsaicin. Closed arrowhead marks a microglia-neuron contact. Scale bar, 50 μm. (f, g) Quantification of the fraction of TRPV1-mTagBFP+ neurons contacted by microglia (f) and the number of microglia per lateral tectum field of view (g). Each dot represents one larval tectum, analyzed by Wilcox rank-sum test (n=fish/neurons, n=16/62 DMSO, 10/19 capsaicin). (h) Schematic of glutamate uncaging and analysis of microglial motility. (i, i’) Example frames of glutamate uncaging near neurons sparsely-labeled with GCaMP6s. Closed dot marks the point of uncaging, open dot shows the position after uncaging, and cell numbers match transient traces in (i’). Representative example from one of 9 larvae (Extended Fig. 4). Scale bar, 20 μm. (j) Timelapse imaging frames of microglia in larvae treated with DMSO vehicle or MNI-glutamate, before and after focal 405 nm uncaging at the open circle. Dotted line divides microglia into uncaging and opposite sides (described in (h)) and arrowheads indicate newly formed processes. Scale bar, 10 μm. (k, l) Total process extensions and retractions per cell in each group (k) and net movements toward the uncaging point (l). Wilcox rank-sum test, n=fish/microglia, n=10/10 DMSO, 11/11 MNI-glutamate.