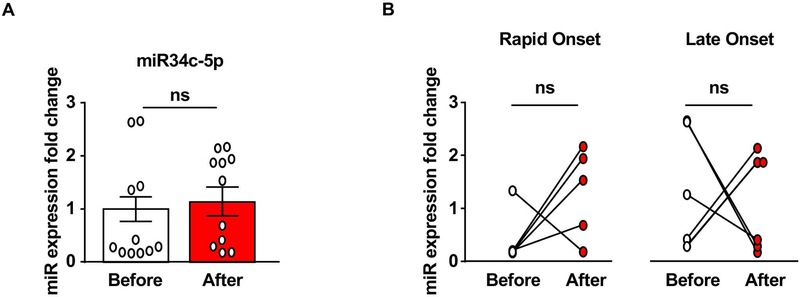
Figure 5. miR34c-5p is not altered in the serum of heavy alcohol drinkers.
Experimental design is depicted in Figure 1A, and described in Figure 4. Animals were bled via lateral tail vein one week before the initiation of the drinking paradigm (basal) and 24 hours after the final drinking session. miR34c-5p was measured by qRT-PCR. (A) Bar graph depicts individual data point and mean +/− SEM of miR34c-5p before (white) and after (red) alcohol use. (B) Individual data points from Late Onset (right) and Rapid Onset (left) animals. (A) n=11, two-tailed paired t-test: t(11) = 0.64, p = 0.54. (B) n=6 Late Onset n=5, Rapid Onset, two-way repeated measures ANOVA with Bonferroni post-hoc test: Rapid Onset before vs. after p=0.27, Late Onset before vs. after p=0.83. ns: non-significant.

