
Fig.4.
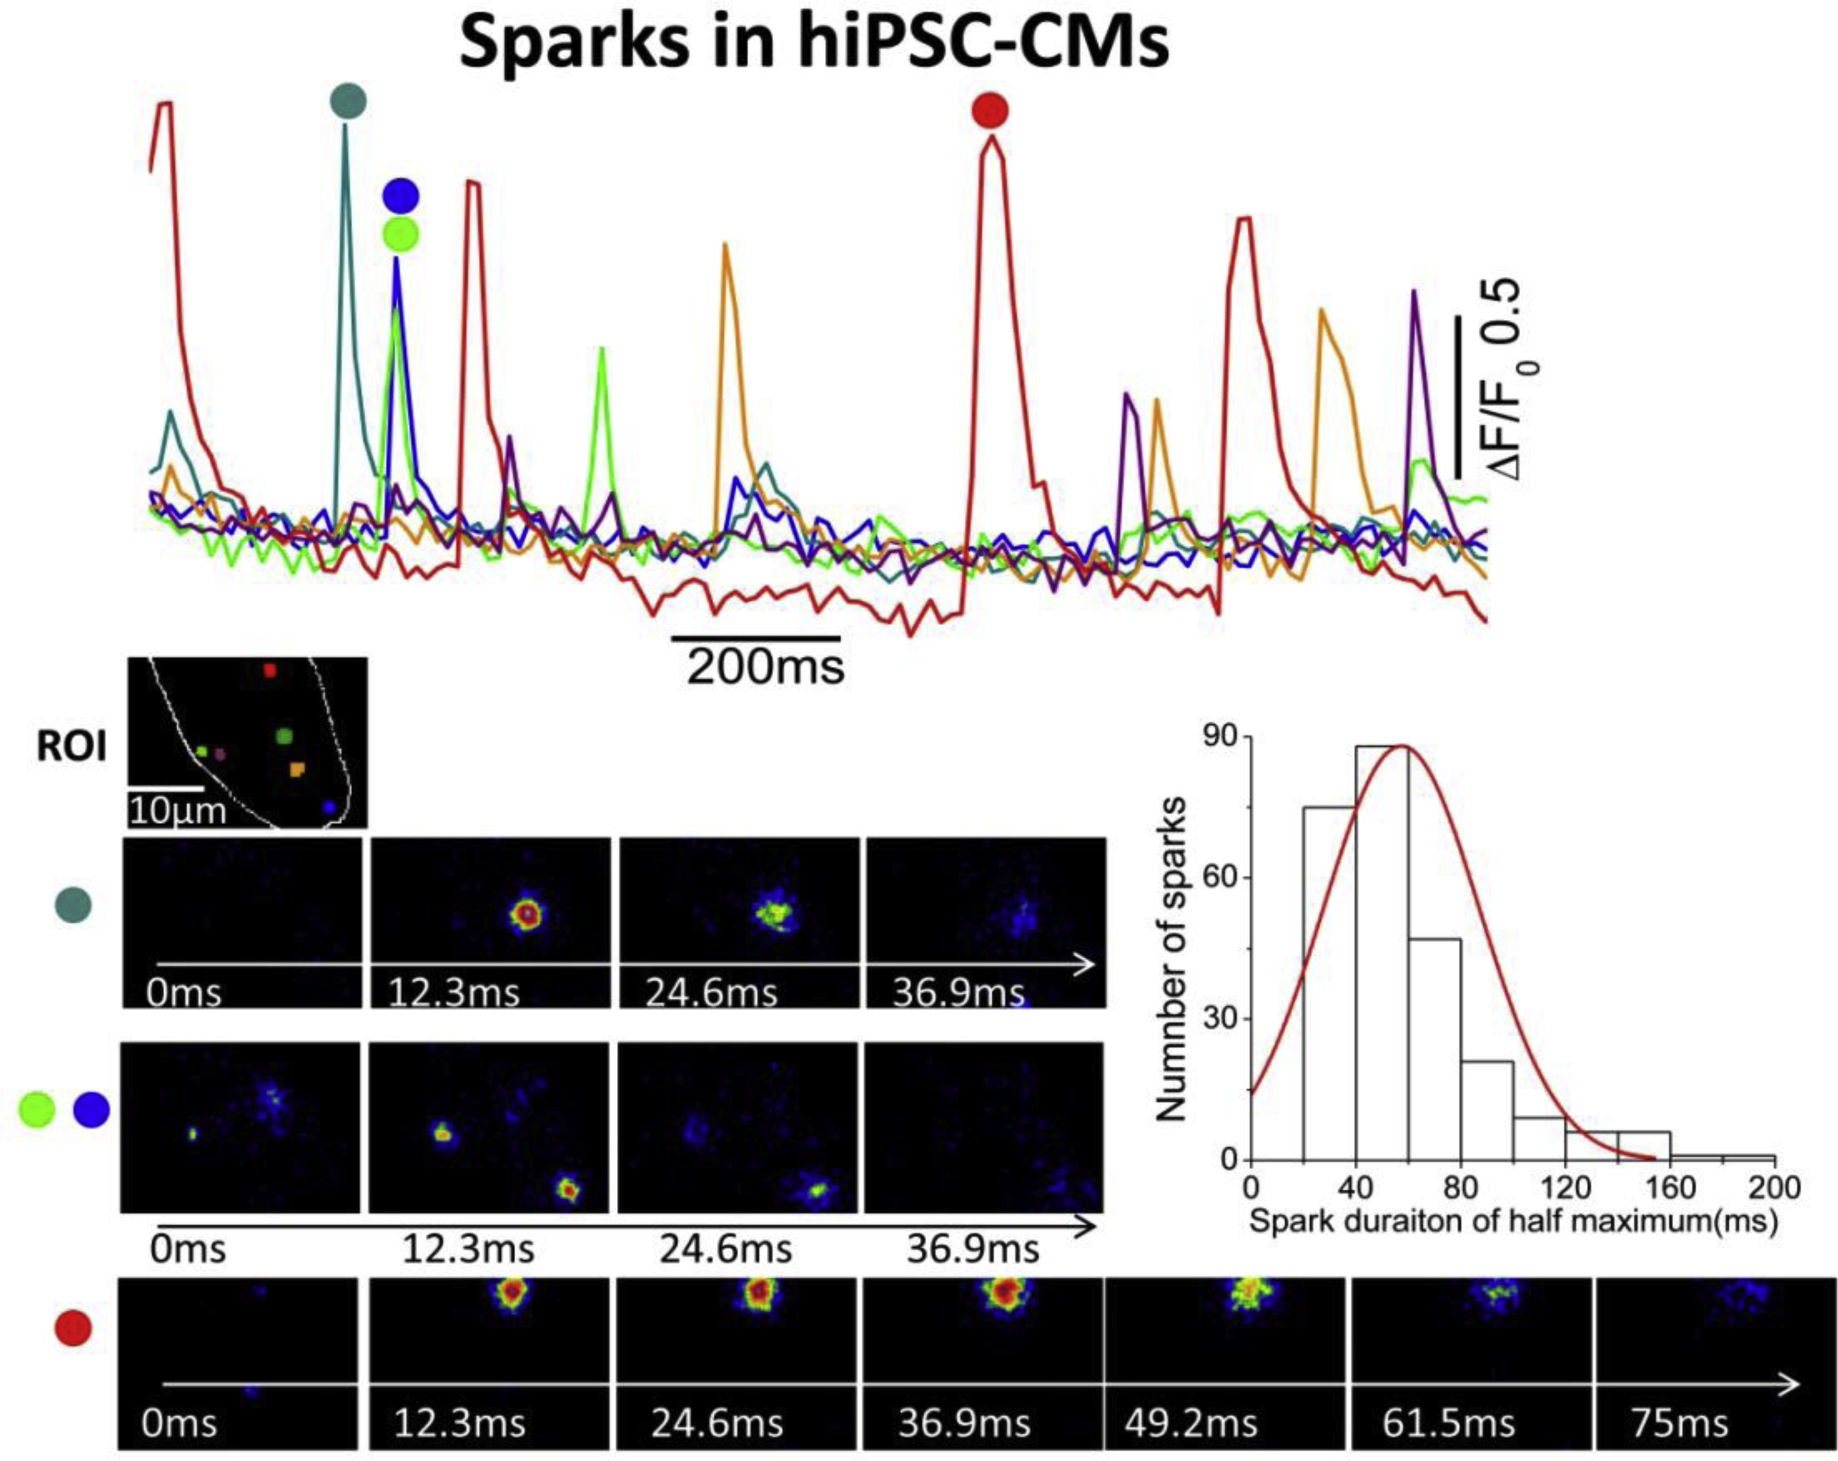
Ca+ Sparks in hiPSC-CMs recorded with TIRF microscopy. The color traces show the time course of normalized Ca2+-dependent fluorescence changes at the selected color-coded regions (ROI) in a single hiPSC-CM. The images show the example of evolution of sparks at different color-coded regions. The sparks were recorded at 12.3ms/frame, ~80Hz. The teal, green and blue sparks are developed and decayed much faster as compared to the red sparks. The histogram shows the distribution of spark durations of half maximum.