
Figure 3. The ARE DNA-bound AR/SRC-3/p300 complex density map and segmentation.
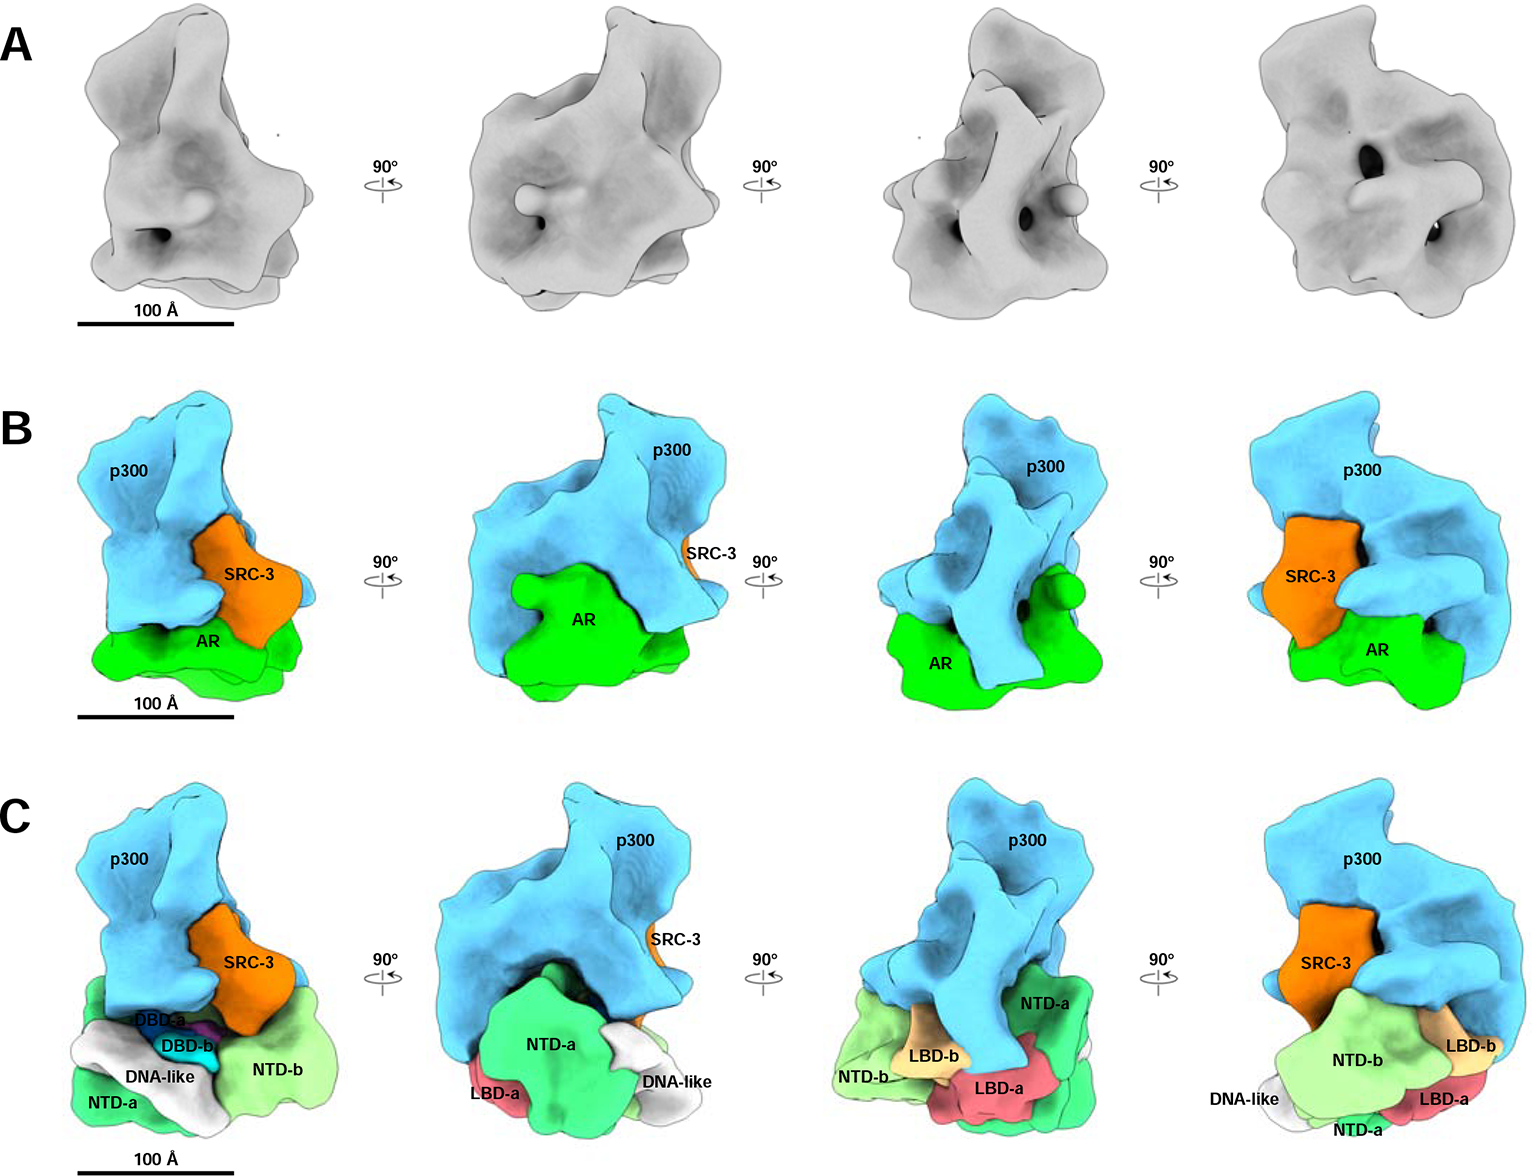
(A) Cryo-EM density map of the ARE DNA-bound AR/SRC-3/p300 complex at resolution ~20 Å. Shown are 4 different angles of the map rotating every 90 degrees. (B) Segmentation of ARE-DNA/AR/SRC-3/p300. Each component was segmented to annotate different proteins: AR, Green; SRC-3, Orange; p300, Blue, respectively. (C) The assembled ARE-DNA/AR/SRC-3/p300 structure with segmented ARE-DNA/AR density (Figure 1B) replacing the AR density. The p300 density mainly interacts with two NTDs of AR and has a small area touches the two LBDs. See also Supplemental Figure 3, 4, 5 and Supplemental Table 1.