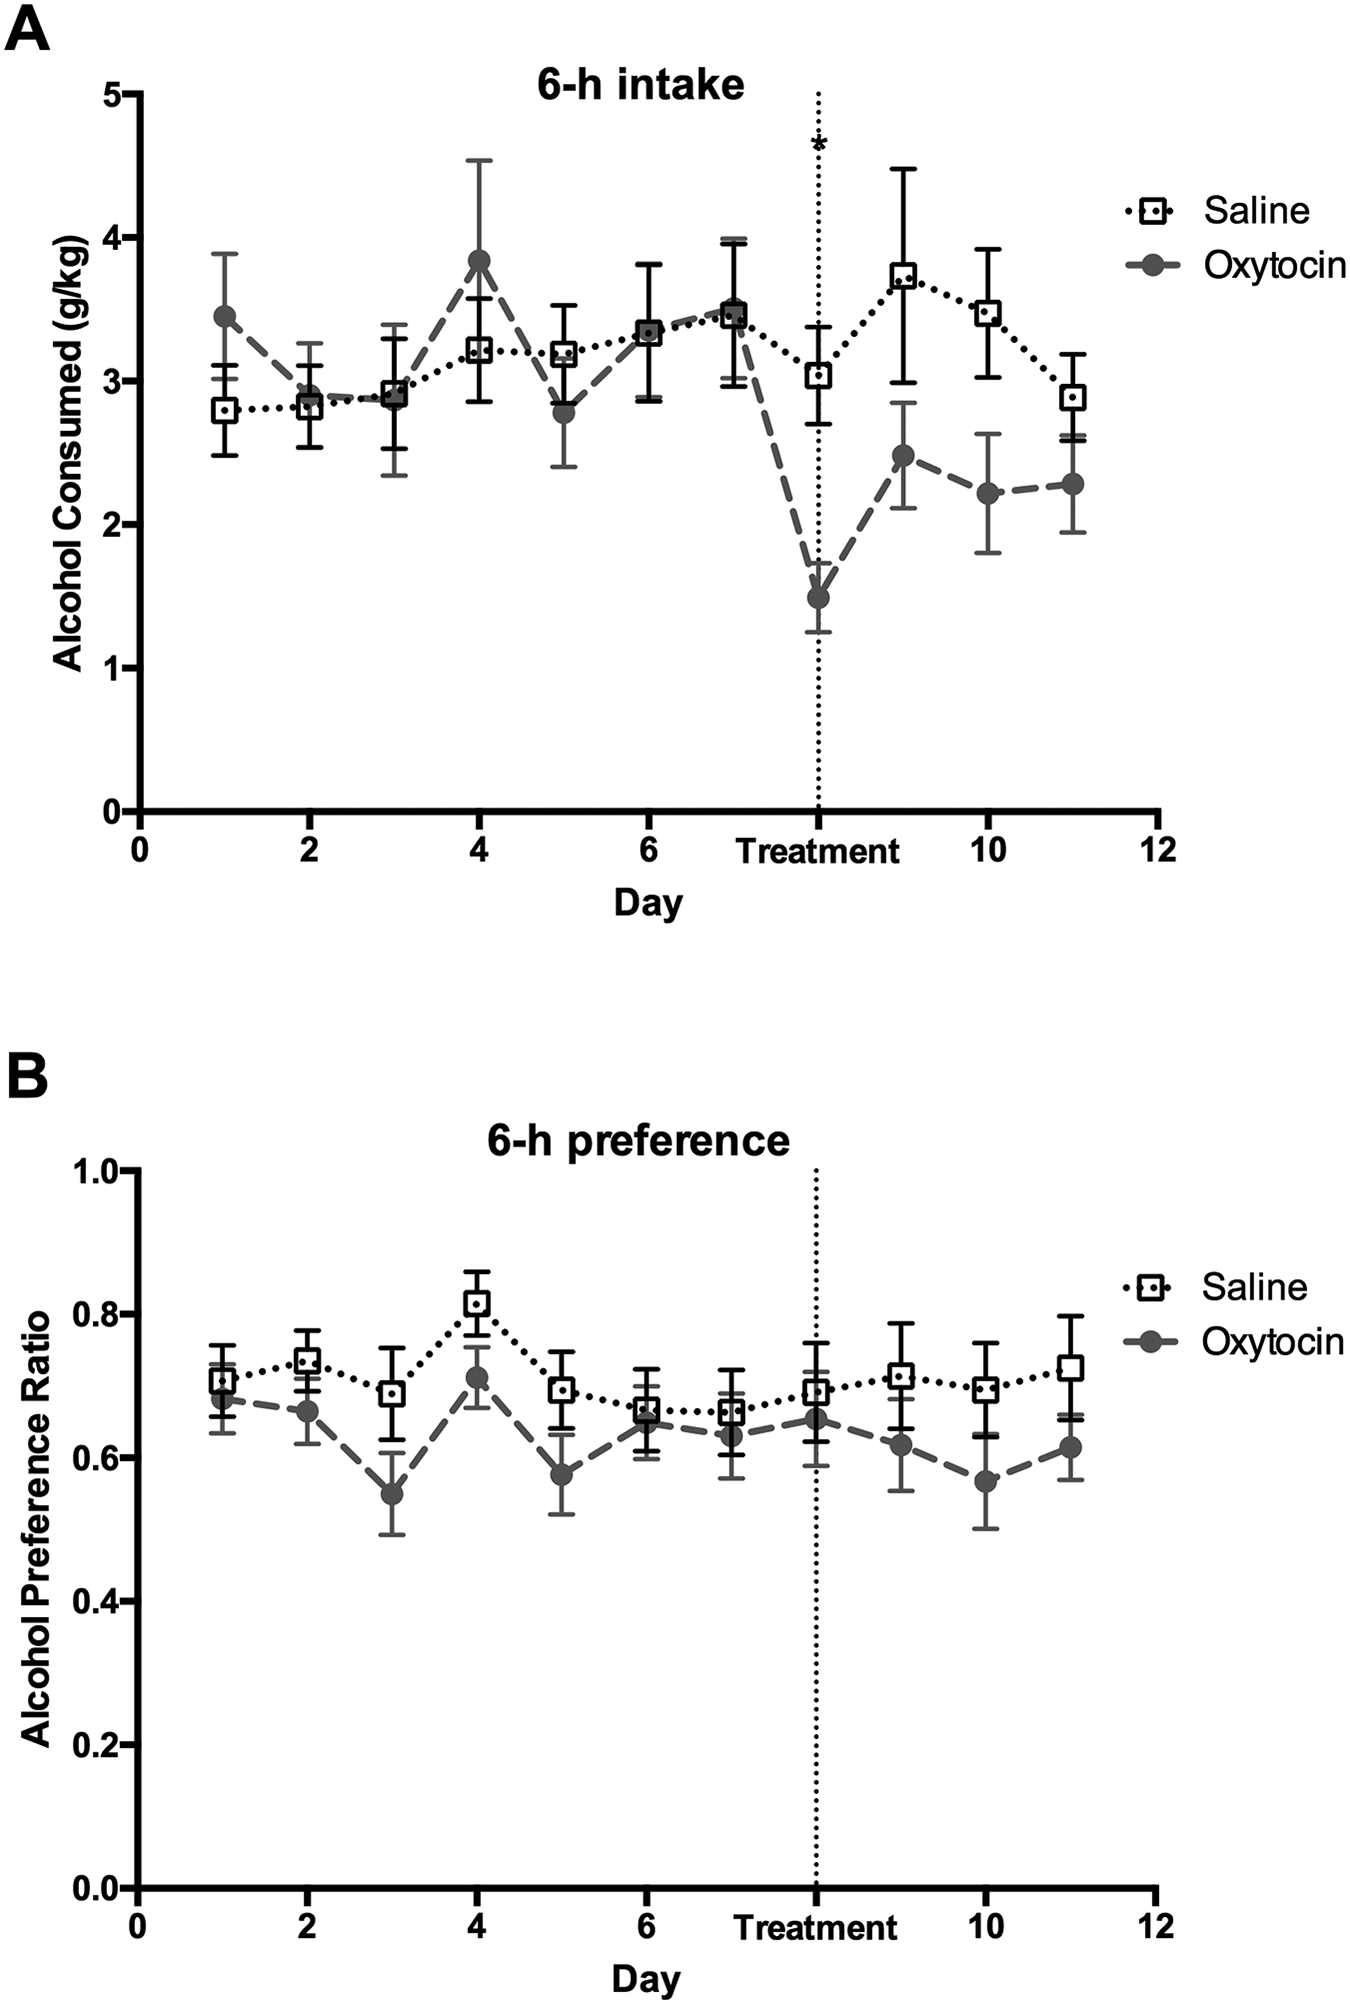
Figure 3: Alcohol consumption and preference in the first six hours of alcohol access following oxytocin treatment when animals in the same cage receive different treatments.

(A) Alcohol consumption during the first day of treatment was lower in the oxytocin group versus the saline-treated animals. (B) Alcohol preference did not differ between treatment groups during any day of alcohol access. *p<0.05. Error bars indicate mean ± SEM.
