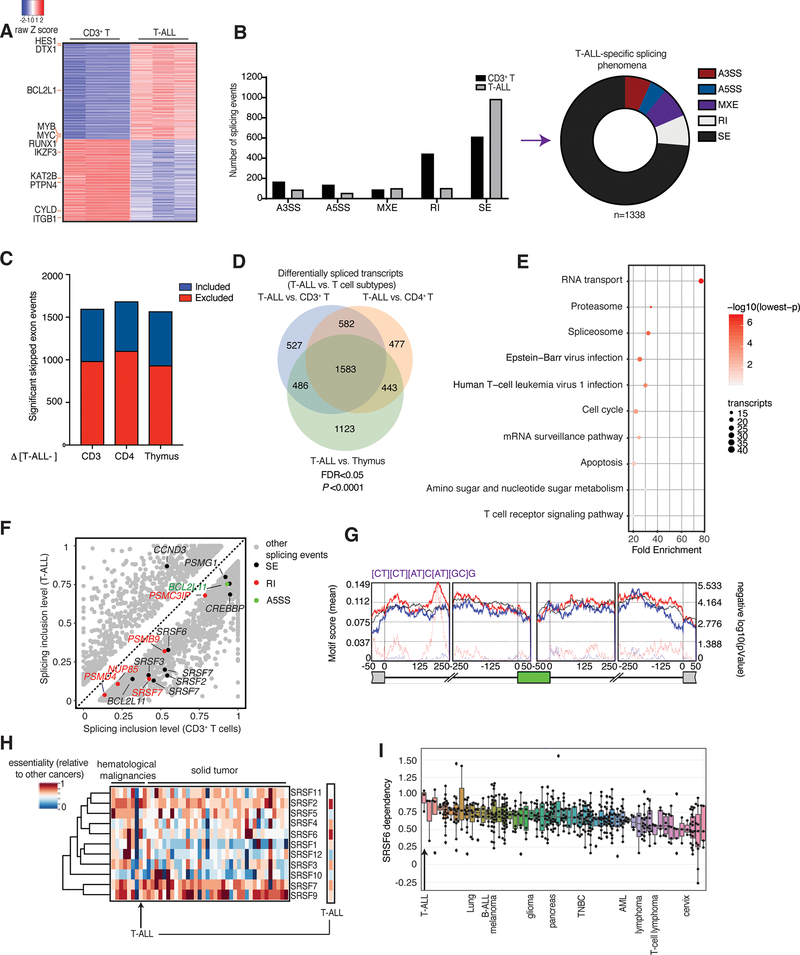
Fig. 1. Extensive changes in exon skipping phenomena in T-ALL compared to physiological T cells.
A, Heatmap of gene expression changes representing 630 significantly up-regulated genes and 531 down-regulated genes in T-ALL patient samples compared to CD3+ T cells, ranked based on expression level in T-ALL (n=3, adj. P<0.01). B, Differential splicing in T-ALL versus CD3+ T cells. Bar graph (left) represents different types of splicing events; pie chart (right) shows T-ALL specific splicing phenomena (correspond to the grey bars). The plot represents the MATS analysis using three biological replicates per group. Only events that passed the statistics threshold (FDR, false discovery rate <0.05) and percent spliced in (PSI) > 0.1 (10% of the transcripts of a given gene) are taken into consideration. Exon skipping (SE) is the type of event affected most significantly. A3SS, alternative 3’ splice sites; A5SS, alternative 5’ splice sites; MXE, mutually exclusive exons; RI, intron retention. C, Directionality of exon skipping in T-ALL compared to T-cell subtypes, where positive (blue) and negative (red) values represent exon inclusion and exclusion, respectively. Please note there is a higher number of skipped exons in T-ALL (red) compared to any T cell subtype. Panels B and C collectively show that there are more skipped exons in T-ALL compared to normal T cells. D, Overlapping transcripts affected by splicing changes in T-ALL compared to CD3+ T cells, CD4+ T cells, and thymocytes (FDR <0.05). E, Kyoto Encyclopedia of Genes and Genomes (KEGG) analysis showing main transcript pathways enriched in splicing events in T-ALL compared to CD3+ T cells. Transcript categories are ranked based on the enrichment score, P value and size of the group. F, Scatterplot of splicing changes and distribution in T-ALL compared to CD3+ T cells. Selected transcripts are colored based on the type of differentially spliced event. Transcripts presenting PSI>0.1 are shown. G, De novo binding motif discovery based on exon skipping data (including the skipped exon and flanking intron/exon sequences) in T-ALL vs. CD3+ T cells using rMAPS. SRSF6-bound motif enrichment in skipped exons in T-ALL (red) and in included exons in CD3+ T-cells (in blue) is shown. Background motif enrichment is shown in black and -log (p Value) over the background is represented by red and blue dotted lines. H, Relative essentiality of the SRSF gene family across different types of cancer cell lines. Essentiality data, reflecting the importance of individual genes for cellular fitness, was obtained from the Project Achilles CRISPR-Cas9 screening dataset of 563 cancer cell lines. I, Essentiality for SRSF6 amongst different cancer types from the Project Achilles. A gene essentiality score of 1 is typical for genes considered pan-essential, such as ribosome components. T-ALL and other representative cancer types are shown. B-ALL, B cell acute lymphoblastic leukemia; TNBC, triple-negative breast cancer; AML, acute myeloid leukemia.

