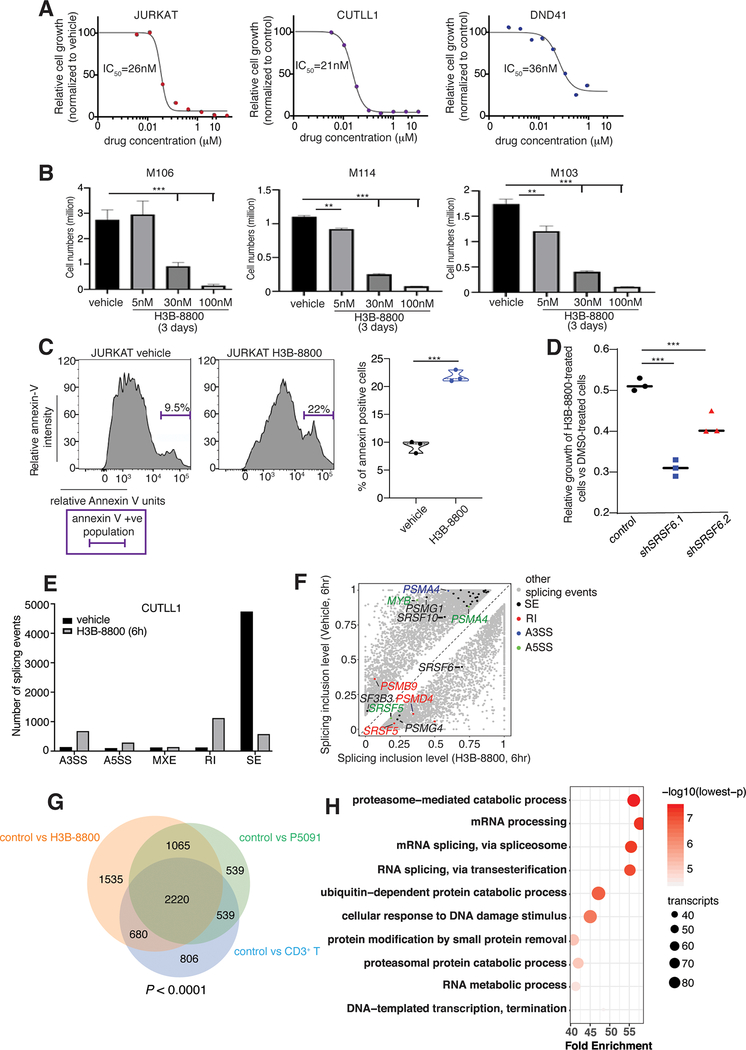
Fig. 4. Inhibition of splicing blocks the growth of T-cell leukemia tumors.
A, IC50 curves of splicing inhibition using H3B-8800 in T-ALL cell lines (JURKAT, CUTLL1, DND41) over a period of 72h. To study cell growth, 3,000 cells per well were used and incubated with alamarBlue for 4 h. B, Cell numbers for three patient samples treated with vehicle and increasing concentrations of H3B-800 up to 100nM over a 72h period. Live human T-cell leukemia cell populations were measured using cytometry and staining with hCD7 and hCD45 antibodies (***, P < 0.001). C, Annexin V staining plots (left panel) and quantification (right panel) upon treatment with 30 nM H3B-8800 over a period of 48 h in JURKAT T-ALL cells (n=3, ***, P<0.001). D, Relative growth of H3B-8800-treated cells compared to vehicle-treated cells is shown for control, shSRSF6.1, and shSRSF6.2-expressing CUTLL1 cell populations. shSRSF6.1-expressing cells present with an increased sensitivity to splicing inhibition compared to control cells (n=3, ***, P<0.001). E, Number of splicing events in CUTLL1 cells upon treatment with H3B-8800 for 6 h versus DMSO (vehicle). Retained introns (RI) and skipped exons (SE) were the two event categories affected most dramatically. The plot represents the MATS analysis using three biological replicates per group. Only events that passed the statistics threshold (FDR <0.05) and percent spliced in (PSI) > 0.1 are presented. F, Scatterplot of splicing changes and distribution in H3B-8800-treated CUTLL1 cells (6h) compared to vehicle-treated CUTLL1 cells. Selected transcripts are colored by the type of differentially spliced event. Splicing is quantified using a “percent spliced in” value (PSI, or ψ value) and changes affecting at least 10% of transcripts are presented. G, Overlapping of transcripts affected by splicing changes in vehicle-treated JURKAT cells in comparison to H3B-8800- and P5091-treated JURKAT cells as well as CD3+ T cells. Analysis identified 2220 transcripts alternatively spliced in vehicle-treated JURKAT cells compared to the three other conditions. H, Gene ontology analysis of 2220 overlapping genes from (G) showing enrichment of critical transcript families, including the proteasome- and spliceosome machinery-encoding transcripts.

