
Figure 2.
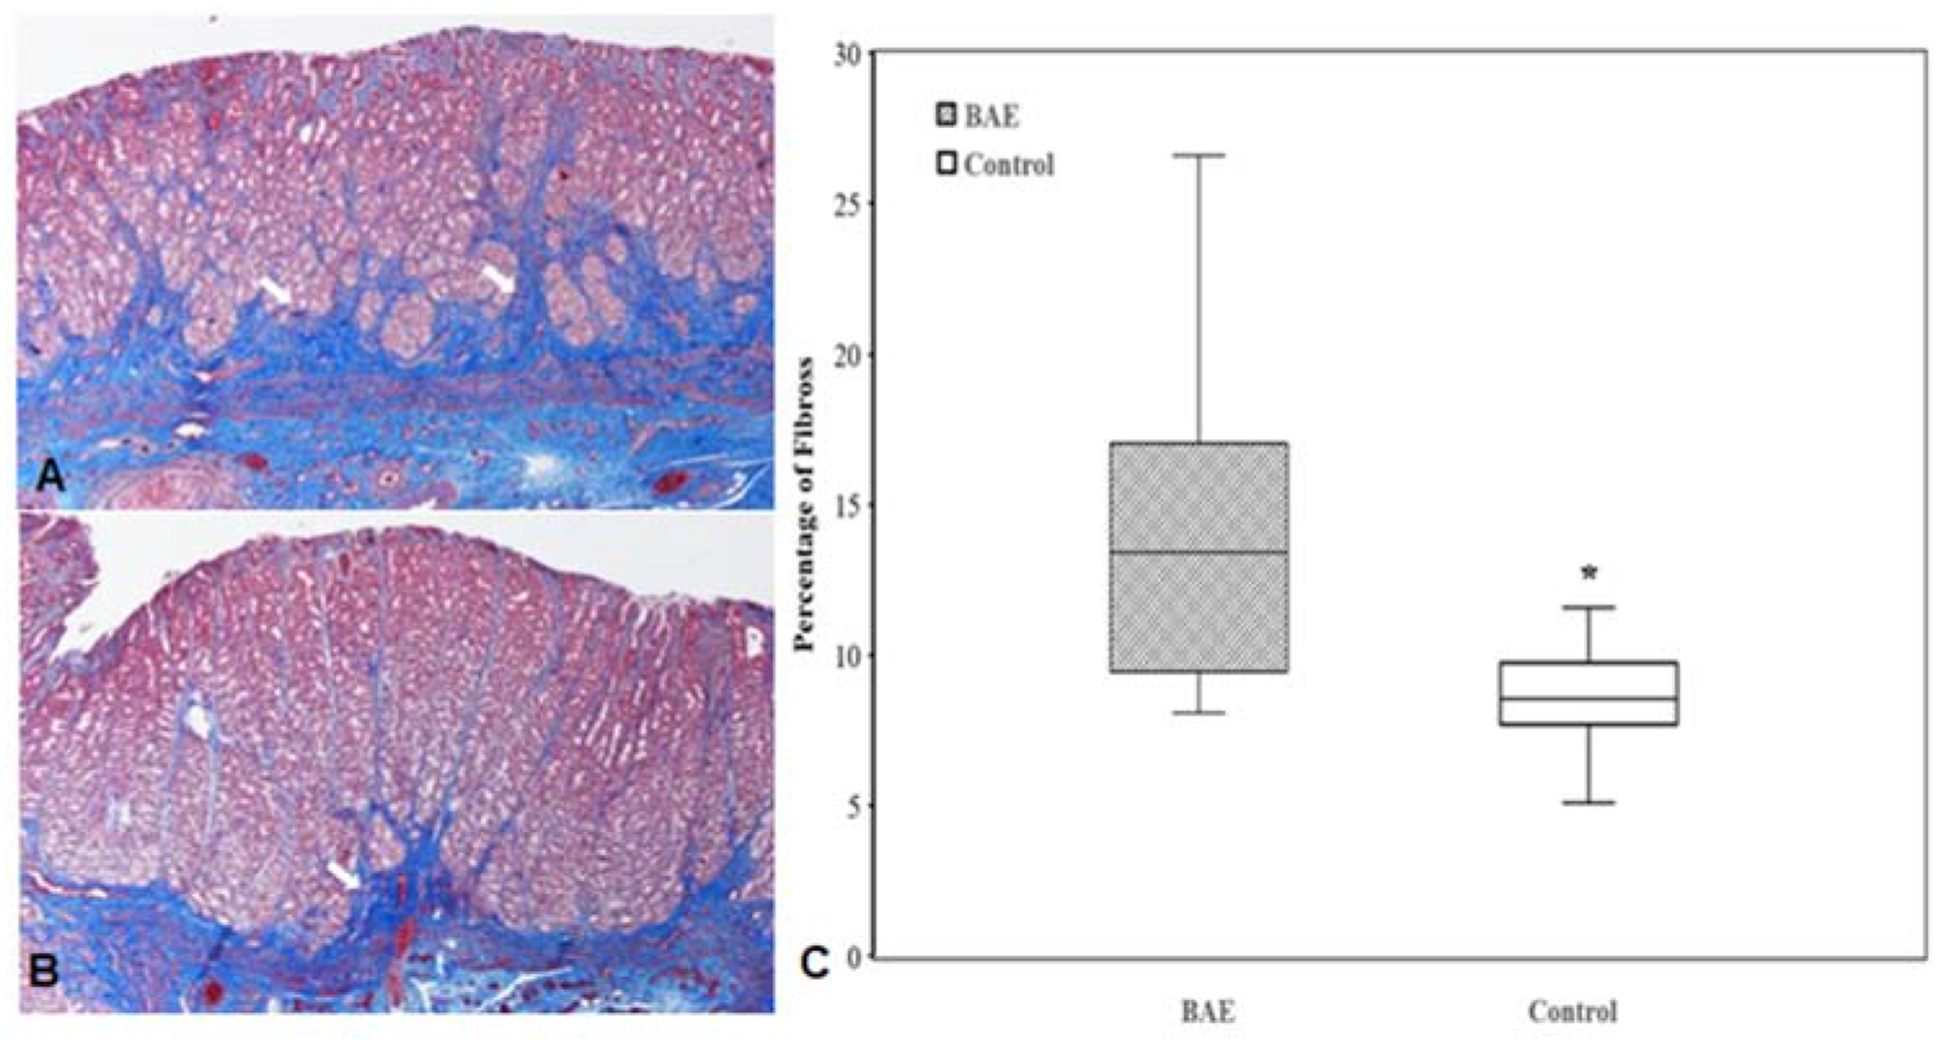
In vivo X-ray visibility of XEMs. (A) Sub-selective angiogram of left gastroepiploic artery shows the placement of the anti-reflux catheter. (B) Single shot X-ray image during right gastric artery embolization shows the visibility of XEMs during delivery (arrows). (C, D) Coronal view of CBCT images of the stomach immediately (C) and 4 weeks (D) after embolization shows persistent visualization of XEMs in the stomach (arrows). (E) Graph of CT numbers for XEMs and bone demonstrates that in vivo radiopacity of XEMs remains unchanged over time and was similar to that of bone (P = 0.9). (F) Axial view of CBCT image of the stomach after BAE reveals non-target embolization mostly to the liver (arrows).