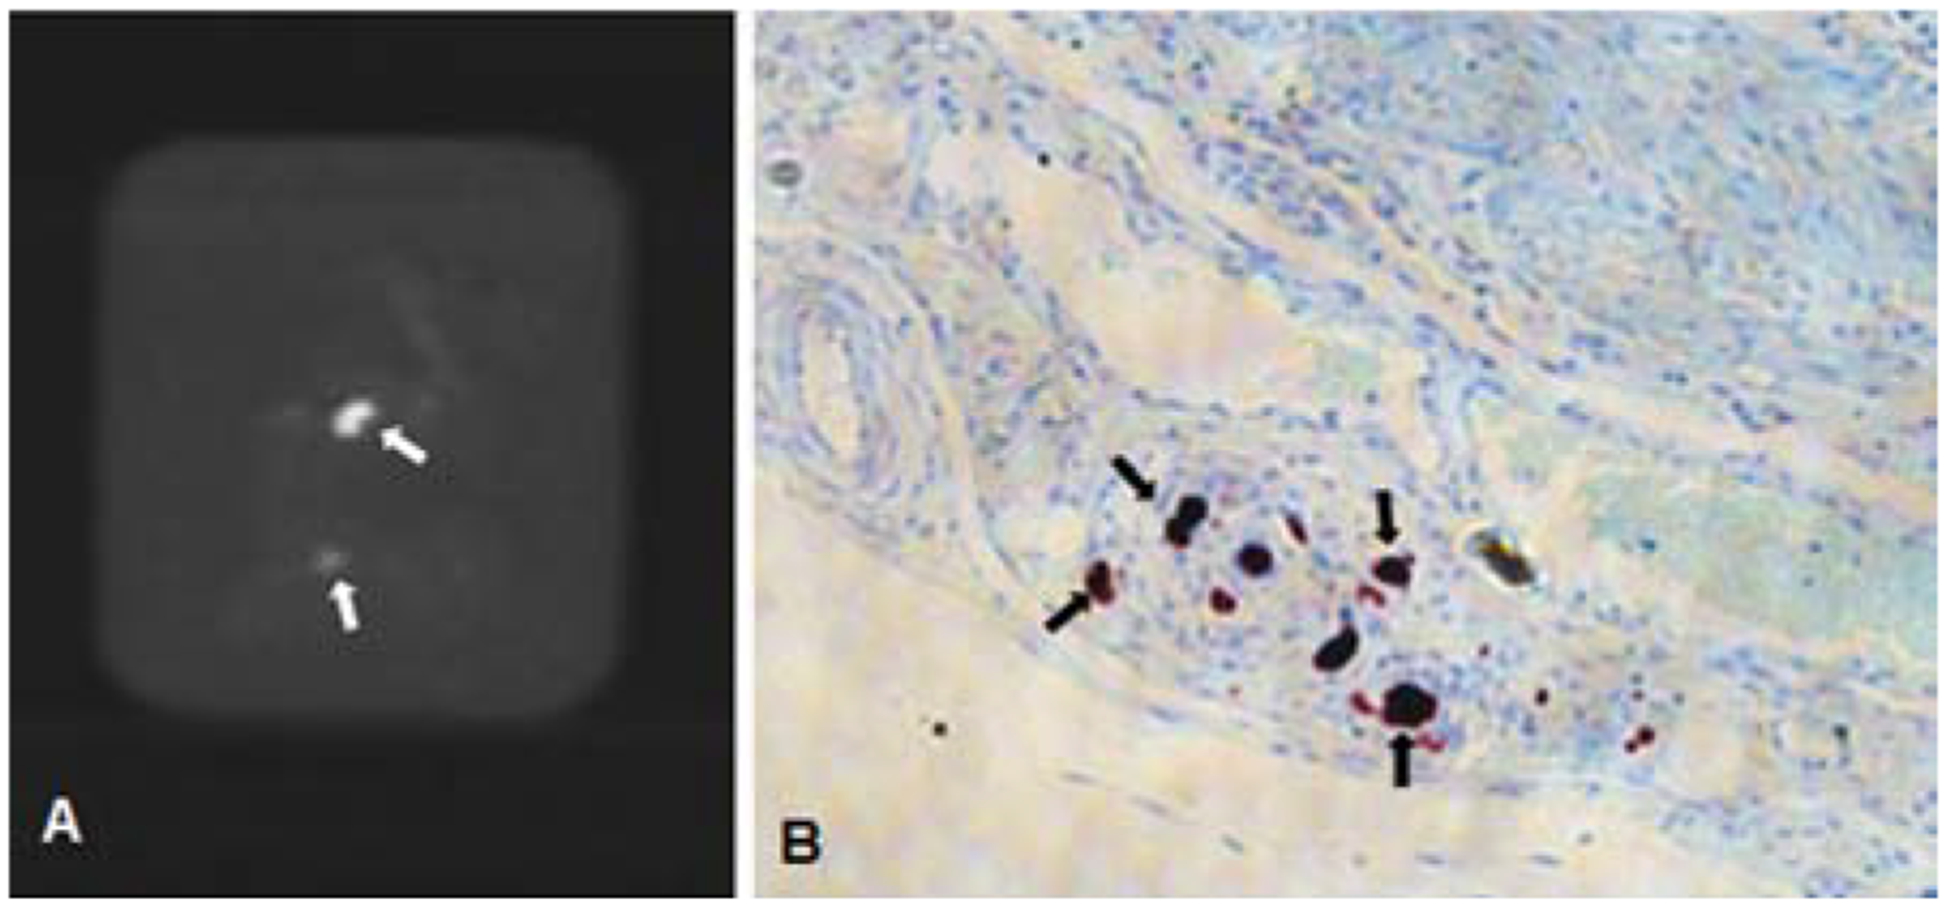
Figure 8.

(A, B) Representative images of immunohistochemical staining of gastrin-expressing cells (arrows) in the gastric antrum of embolized animals (A) and controls (B). (C) Box plot of gastrin-expressing cell counts shows statistically significant reduction of gastrin-expressing cells in the gastric antrum (P < 0.02) of embolized animals as compared to controls.
