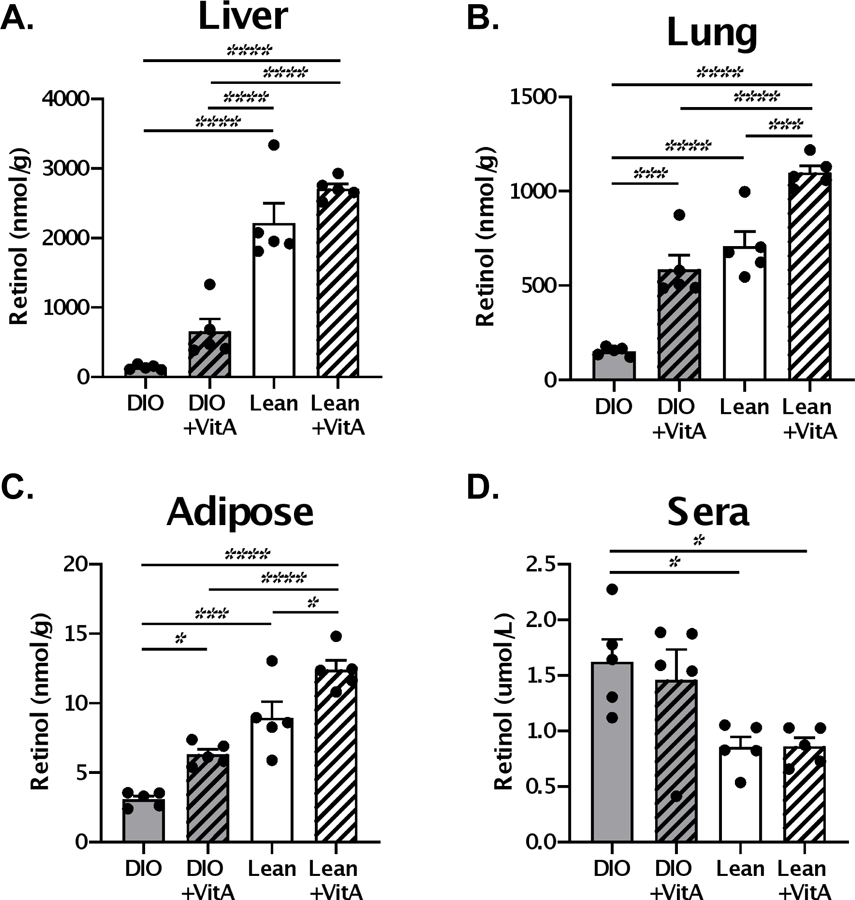
Figure 1. High-dose vitamin A supplementation improves retinol levels in tissues of obese mice.

Mice received 600 IU vitamin A or PBS orally on d.0,3,7,21, 24 and 28. Retinol levels were evaluated in the (A) liver, (B) lung, (C) adipose tissue and (D) of lean and diet-induced obese (DIO) mice one week after administration of last vitamin A dose (d.35). Each dot represents a single mouse with 5 mice per group. A representative experiment is shown for two independent experiments, each with 5 mice per group. Significant differences were determined by two-way ANOVA followed by Tukey’s multiple comparisons test. *p<0.05, **p<0.01, ***p<0.001, ****p<0.0001.
