
Figure 3.
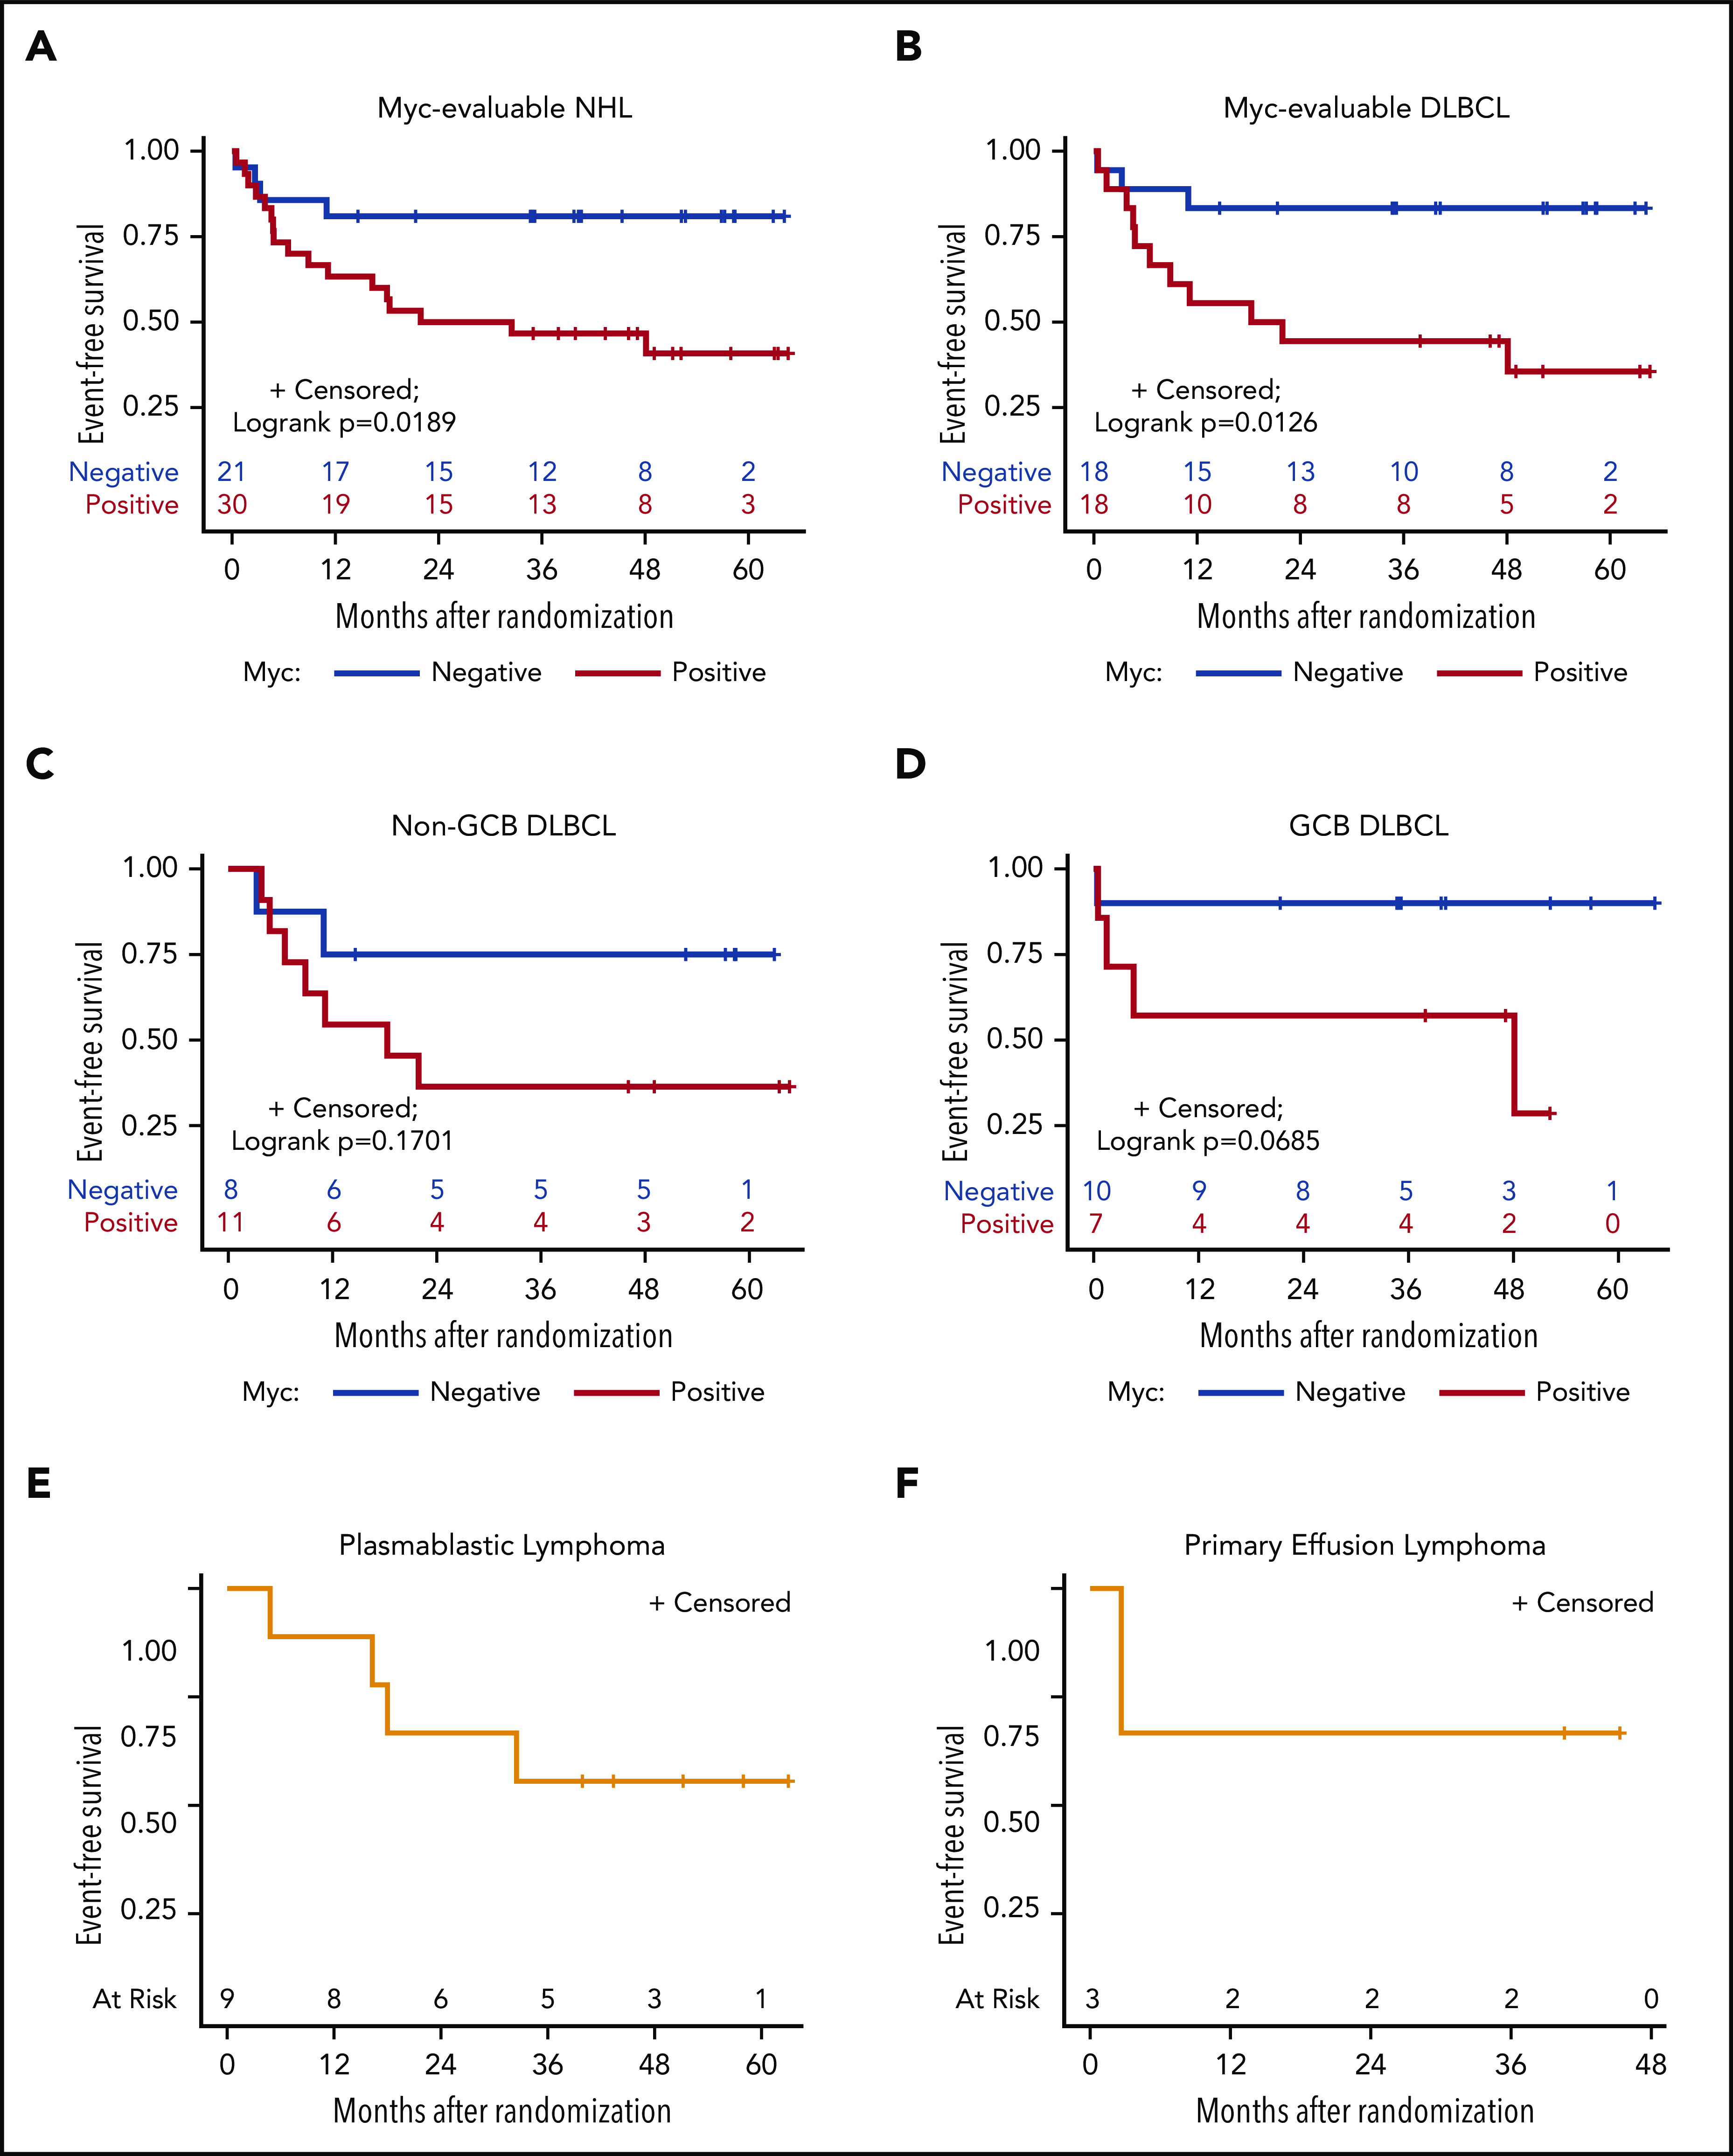
EFS, according to Myc protein expression. Kaplan-Meier curves of EFS in evaluable Myc+ vs Myc− cases in all study-eligible patients with aggressive HIV-NHL (n = 51) (A); all DLBCL (n = 36) (B); non-GCB (n = 19) (C) and GGB (n = 17) (D) DLBCL subtypes; and PBL (9 of 9) (E) and PEL (3 of 3) (F).