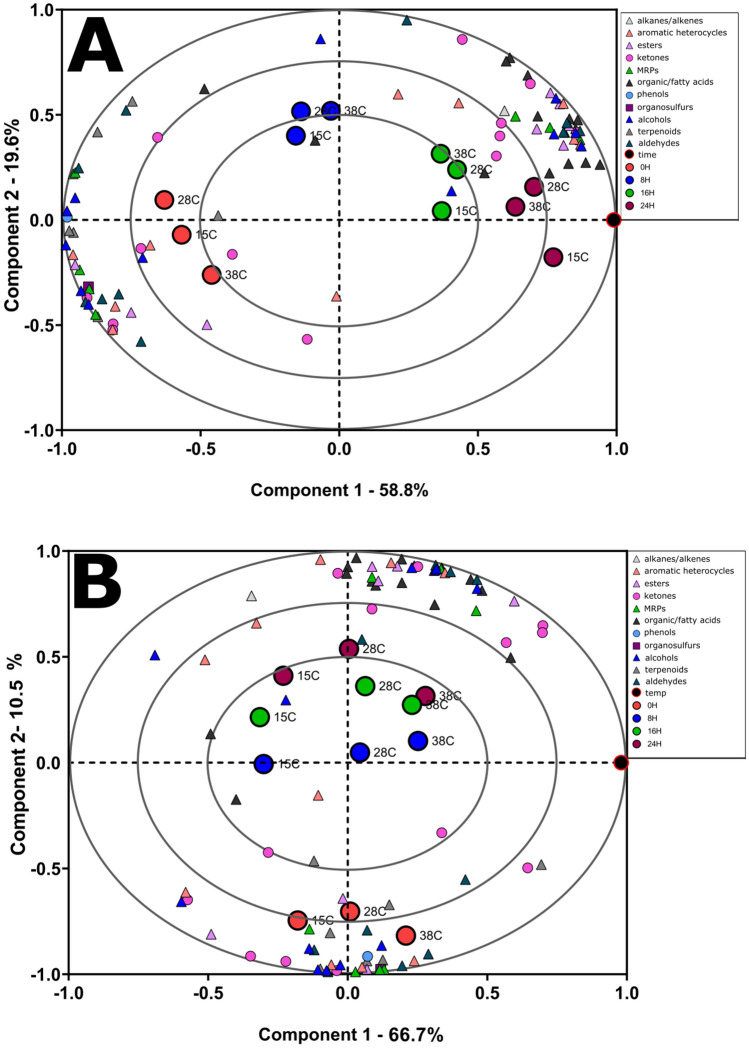
Figure 2.
OPLS analysis of time and temperature trends among the samples. The association between time, temperature, and volatile metabolites in the chocolate was evaluated with orthogonal partial least squares (OPLS) and performed on the 88 annotated metabolites. (A) Biplot for the OPLS analysis based on time. Red circles denote 0-h time point, blue circles denote 8-h time point, green circles denote 16-h time point, brown circles denote 24-h time point, volatile compounds colored by known chemotype descriptors, based on temperature. (B) Biplot for the OPLS analysis based on time. Red circles denote 0-h time point, blue circles denote 8-h time point, green circles denote 16-h time point, brown circles denote 24-h time point, volatile compounds colored by known chemotype descriptors, based on time.

