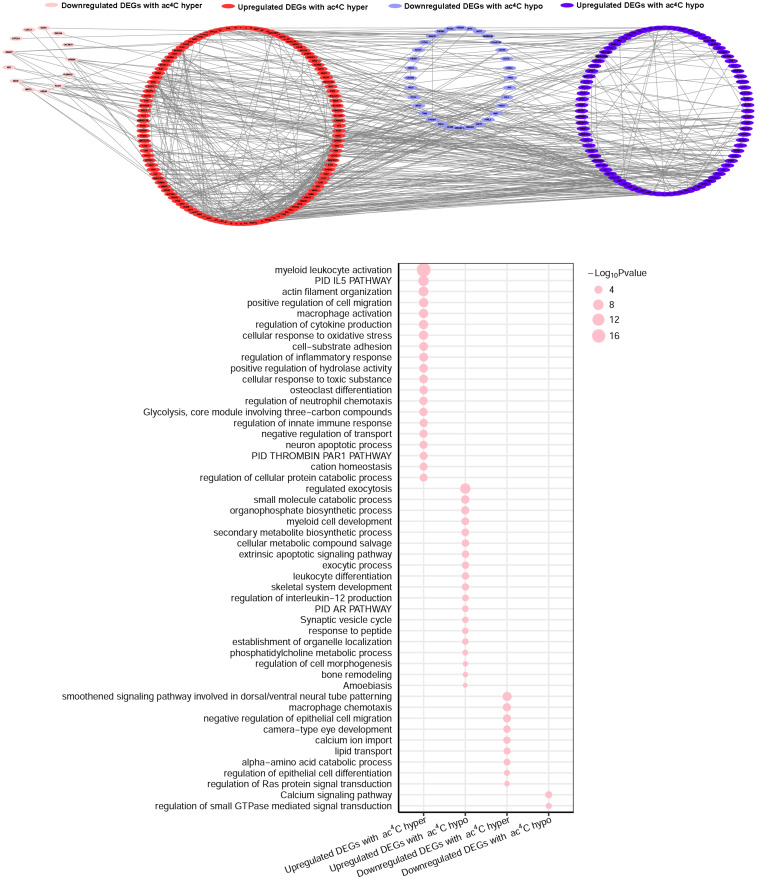
FIGURE 4.
Gene Ontology enrichment map for ac4C-modified DEGs. Groups of upregulated DEGs with ac4C hyperacetylation (red), downregulated DEGs with ac4C hyper (pink), upregulated DEGs with ac4C hypo (dark blue), and downregulated DEGs with ac4C hypo (light blue) are marked in the network (P < 0.01; for details, see Supplementary Tables S3, S4) (top panel). Bubble diagram of GO biological process categories enriched for DEGs with ac4C hyper- or hypo-acetylation. The pink circle represents the –log10 P-value (down panel).

