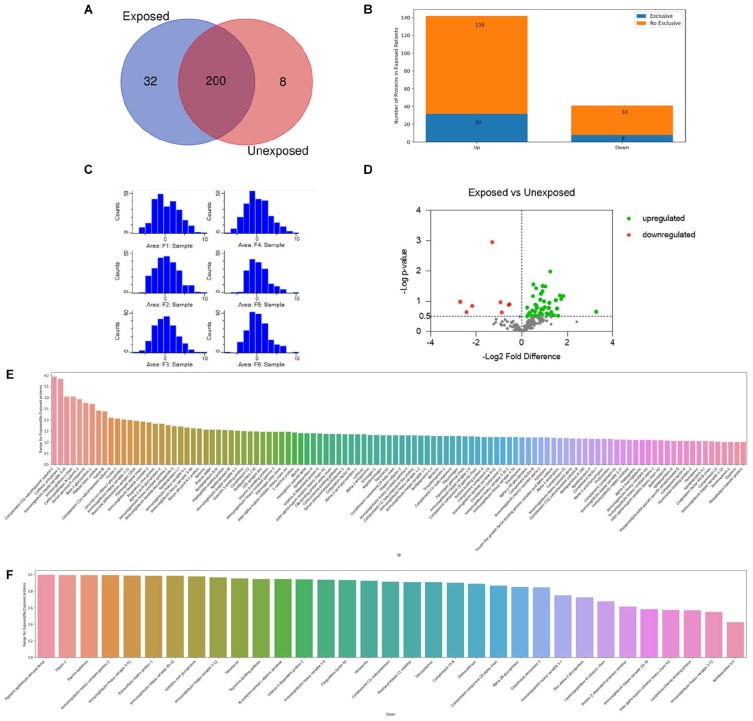
FIGURE 1.
Proteouiic screening results. (A) Venn diagram showing the qualitative distribution of the identified proteins in both groups, 200 proteins identified in both conditions, 32 proteins identified in exclusively in exposed samples, and 8 proteins identified exclusively in unexposed samples. (B) The bars indicate the number of up and downregulated proteins differentially expressed in the exposed patients. Regarding the differentially expressed proteins when comparing the groups: a total of 142 proteins were found upregulated and 41 downregulated in the exposed ones. (C) Histogram of distribution after normalization of the replicates. Exposed (Fl, F2, and F3) and unexposed (F4, F5, and F6). (D) Volcano plot of the differentially expressed proteins between exposed and unexposed samples. In green and red upregulated and downregulates proteins respectivelly. Tn gray proteins with -log p-value < 0.5. Total proteins identified as up (E) or downregulated (F) are reported accordingly to their specific ratios.

