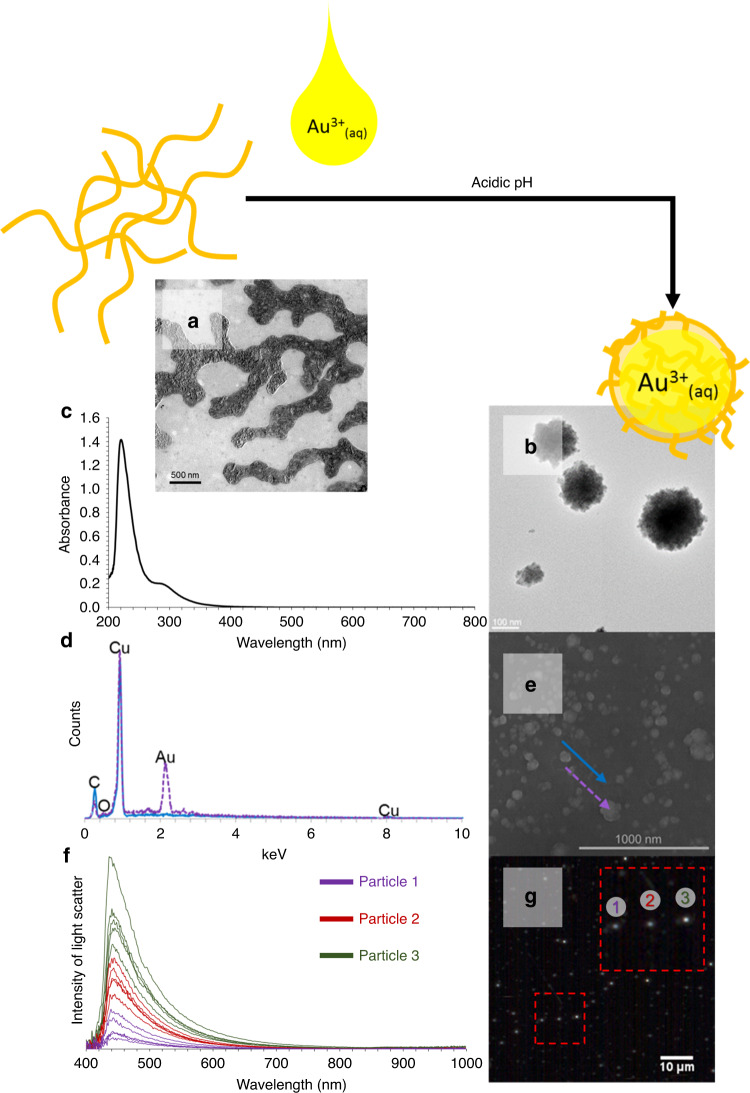
Fig. 1. Characterization of ionic Au-PEG delivery vehicle.
Representative transmission electron microscopy (TEM) images of (a) PEG and (b) ionic Au–PEG clusters. c UV–vis absorbance spectrum of ionic Au–PEG clusters (200–800 nm). d Electron dispersion spectrum of ionic–Au–PEG clusters (on copper tape) captured from (e) scanning electron microscopy-energy dispersive spectra (SEM-EDS). Purple spectra correspond to signal obtained from the clusters, where the blue spectra corresponds to the background. f Spectral intensity of light scatter obtained through enhanced dark field hyperspectral imaging of discrete Au–PEG clusters in solution (n = 3 particles, with 5 spectra from each). g Enhanced darkfield hyperspectral image with 2X digital magnification where the red box highlights the particles those represent the spectra as shown in (f).

