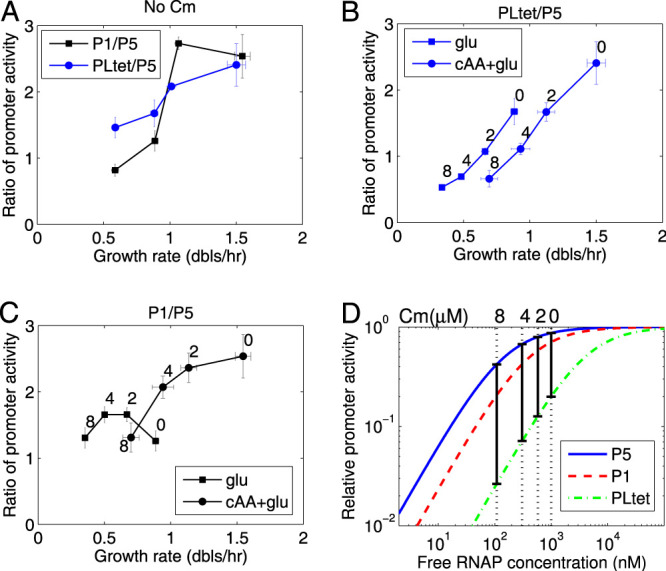
FIG 2.

Ratios of promoter activities for the different promoters can be used to estimate the changes in the concentration of free RNAP. (A) Ratio of PLtet to P5 and P1 to P5 as a function of growth rate (in doublings per hour). (B) Ratio of PLtet to P5 with increasing chloramphenicol concentration. (C) Ratio of P1 to P5 with increasing chloramphenicol concentration. (D) Estimated decrease in the concentration of free RNAP from the change in the ratios of promoter binding as a function of chloramphenicol concentration. To obtain this estimate, the relative activity of the promoters as a function of free RNAP concentration (cf) was obtained from the respective RNAP binding constants, Ki ∈ {K1, K5, KLtet} using cf/(Ki + cf). The constant K5 is determined by fitting the data obtained in the absence of Cm from our experiments and the amount of free RNAP obtained from the literature (34) (see Materials and Methods). K1 and KLtet were derived by the formula K5 exp(ΔE), where ΔE is the difference between the binding energies of RNAP with P1 (or PLtet) and P5 (see Materials and Methods). The black vertical bars indicate the concentrations of free RNAP that give the measured promoter activity ratios shown in panel B for different Cm concentrations, shown above the plot. The ratio of PLtet and P5 promoter activities for example is obtained by taking the ratio of GFP production rates (Gpr): Gpr(PLtet)/Gpr(P5) = a(K5 + cf)/(KLtet + cf), where a is a scaling factor. K5 and a were fixed by fitting the data in the absence of Cm from our experiments and the literature (34) (see Materials and Methods). Data from the cells growing in cAA-glu was used so that ppGpp-dependent regulation of P1 is small and can be ignored. Fig. S2A and B in the supplemental material shows the estimation of RNAP concentration for the four growth media used. Fig. S2C and D shows an estimation of the change in ppGpp as a function of chloramphenicol concentration.
