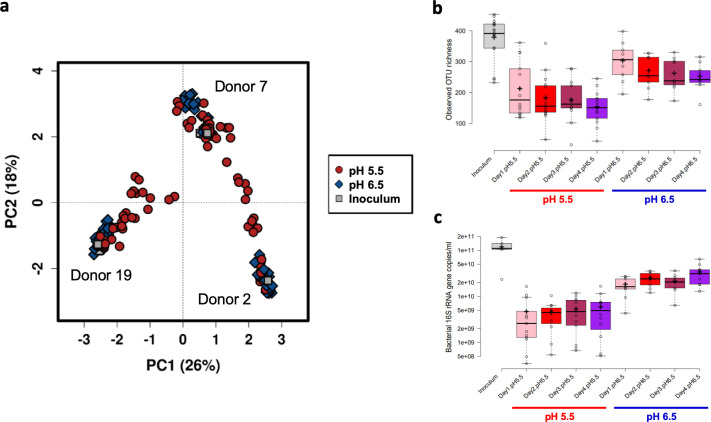
FIG 1.
Impact of pH on fecal microbiota composition within continuous culture fermentor vessels. (a) PCA plot showing the impact of fecal donor and pH on overall microbiota clustering patterns. The text adjacent to each main cluster on the plot indicates the fecal donor (also visualized in the accompanying Fig. S1b). Samples held at pH 5.5 were more variable than those held at pH 6.5 and the original inocula samples, which tended to cluster more tightly. (b) Bacterial richness in original fecal inocula samples, and fermentor samples held at pH 5.5 or 6.5 over the 4-day course of the experiments. (c) Log10 scale 16S rRNA gene counts/ml, as assessed by qPCR, in original fecal inocula samples, and in fermentor samples held at pH 5.5 or 6.5 over the 4-day course of the experiments. For panels b and c, the center lines show the medians; the box limits indicate the 25th and 75th percentiles as determined by R software; the whiskers extend 1.5 times the interquartile range from the 25th and 75th percentiles, with outliers represented by dots; crosses represent sample means; and data points are plotted as open circles.

