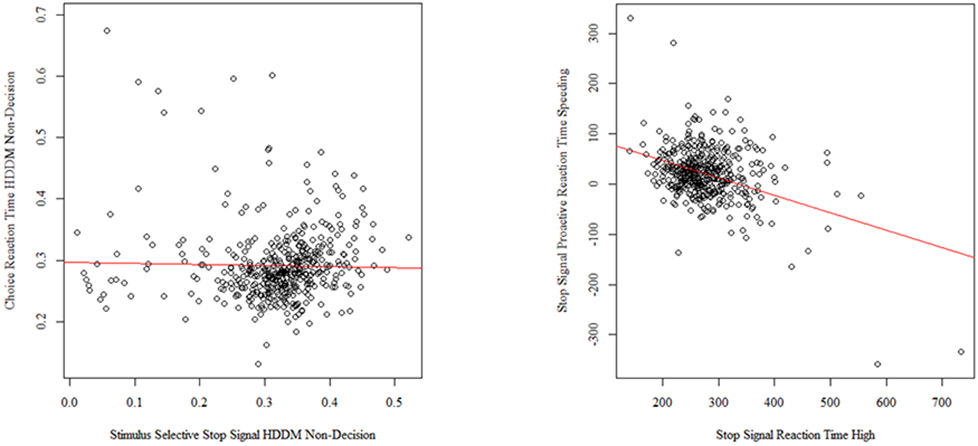
Figure 3.

Scatterplots of variable pairs with discrepant product-moment and distance correlations. The ordinary least squares regression line is provided for each scatterplot. For the variable pair on the left, the distance correlation (.235) was .212 points higher in magnitude than the corresponding product-moment correlation (−.022). For the variable pair on the right, the distance correlation (.257) was .130 points lower in magnitude than the corresponding product-moment correlation (−.388).
