Figure 4.

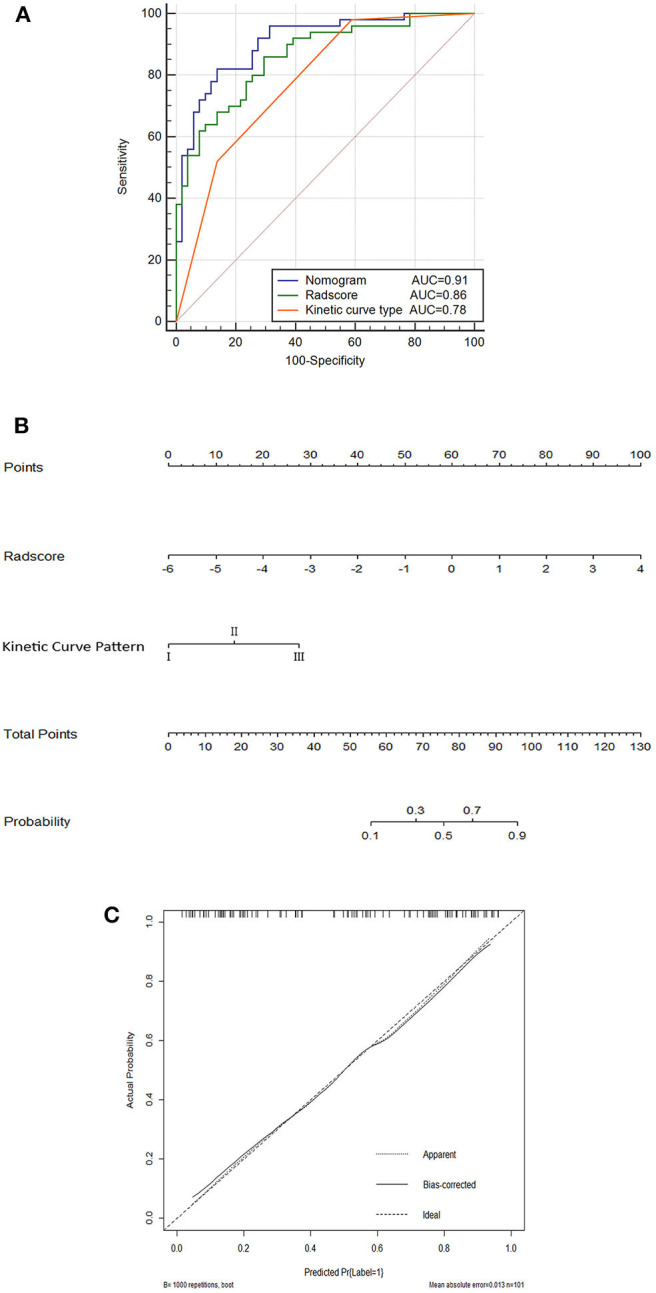
Nomogram (A); ROC curves for the kinetic curve pattern, the Radscore, and the nomogram model (B); and corresponding calibration curves based on the nomogram model (C) in the training cohort.

Nomogram (A); ROC curves for the kinetic curve pattern, the Radscore, and the nomogram model (B); and corresponding calibration curves based on the nomogram model (C) in the training cohort.