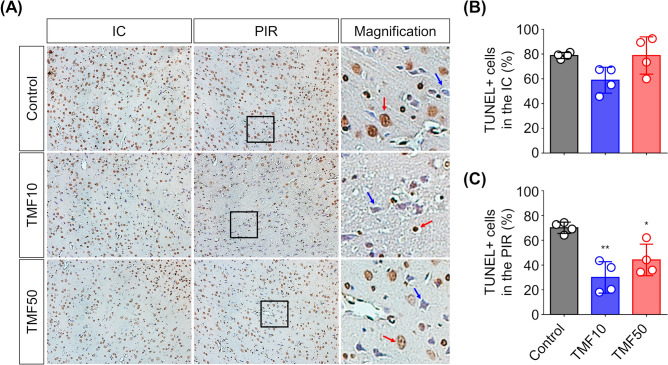
Figure 5.
Reduction in apoptosis after TMF treatment (A) Representative photomicrographs of terminal deoxynucleotidyl transferase dUTP nick-end labelling (TUNEL) staining in the IC and PIR (magnification × 200, scale bar = 100). The right row shows enlarged versions of the black boxes in the middle row (scale bar = 20 μm). Red arrows indicate apoptotic cells; blue arrows indicate viable cells. (B,C) Quantification of the effect of TMF treatment on TUNEL positive (+) cells (%) in the (B) IC and (C) PIR. Data are represented as means ± SDs (n = 4 rats in each group). *P < 0.05 vs. control group; **P < 0.001 vs. control group.

