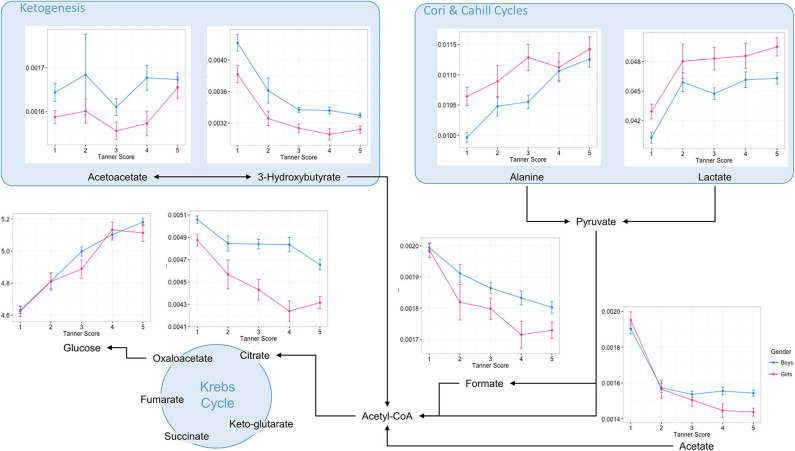
Figure 3.
Overview of central energy metabolic pathways with selected blood serum metabolite patterns according to pubertal stages. Data are plotted as mean ± standard error of metabolite integrals (arbitrary units) and glucose concentration (Mmol/L) measured at the first occurrence of pubertal stages for boys and girls, respectively.

