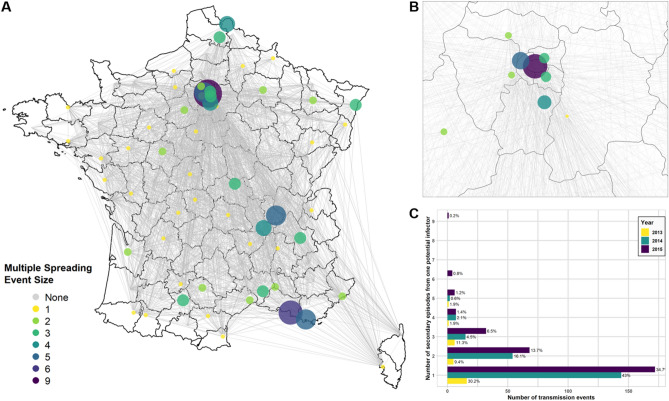
Figure 4.
Multiple spreading events and number of potentially associated secondary incident episodes, 2013–2015. (A) The county network mapping the size or number of linked secondary events to one potential infector episode from 2013 to 2015. (B) A zoomed-in view of Ile-de-France counties including Paris (purple). (C) The distribution of the total number of transmission events and the size of the multiple spreading events with proportions per year.

