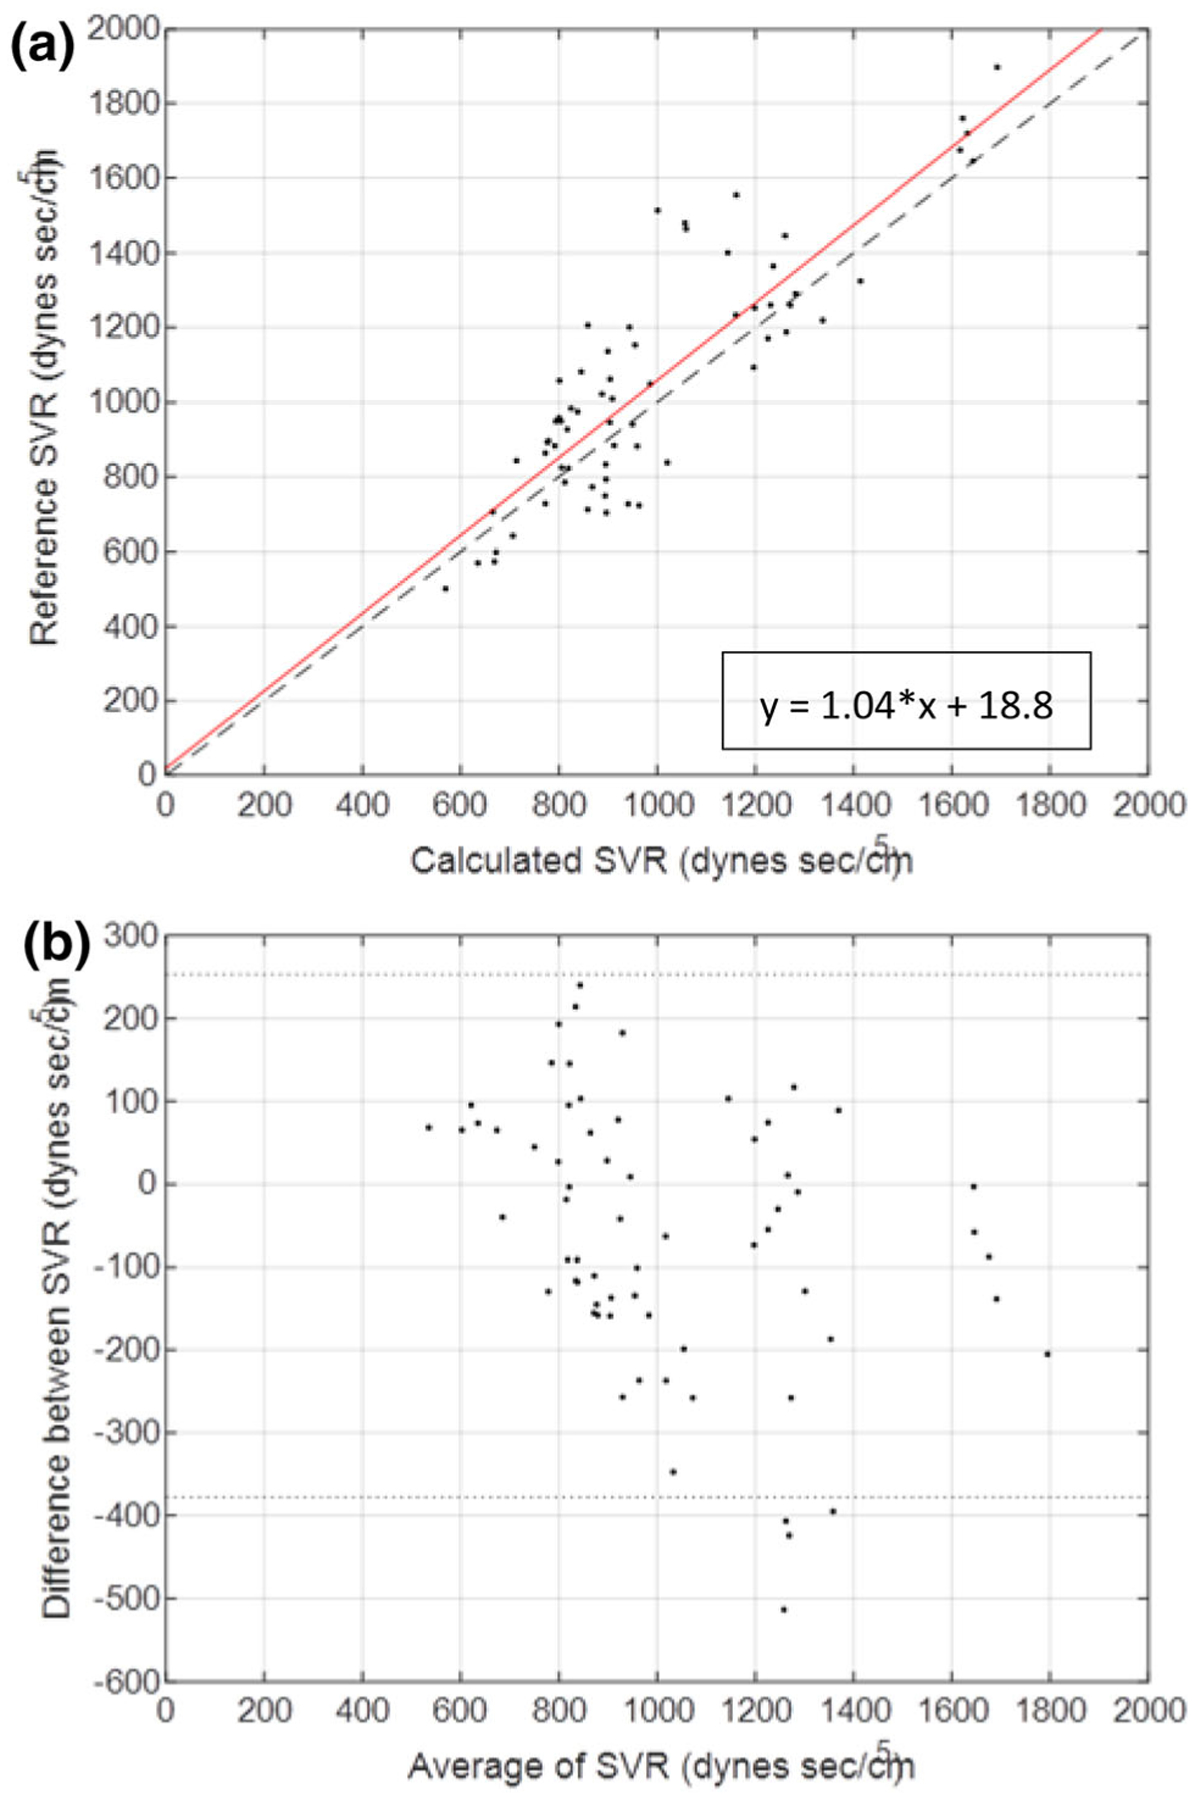
FIGURE 5.

Correlation (a) and Bland–Altman (b) plot of thermodilution-based SVR and algorithm-determined SVR. Data from 5 animals with an Impella pVAD are shown at varying baseline and cardiac intervention states. (a) Correlation plot comparing SVR determined by Eq. 9 and algorithm determined vascular resistance. Least squares regression line shown in red. (b) Bland–Altman plot from the 5 animals indicated with standard confidence intervals using ± 2 standard deviations of the difference between SVR and algorithm determined vascular resistance.
