FIGURE 1.
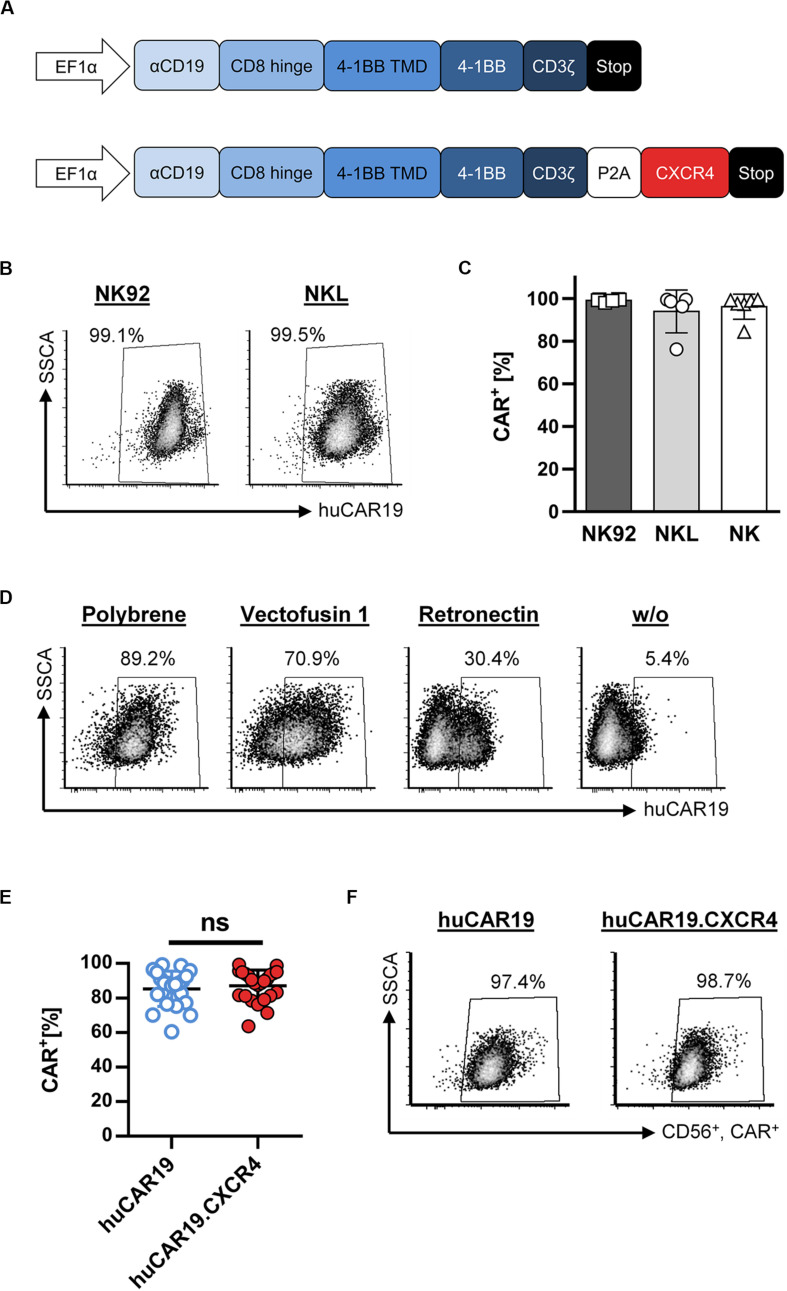
Fully human CAR gene delivery to NK cells. (A) Schematic illustration of huCAR19 (top) and huCAR19.CXCR4 (bottom) constructs used to generate CAR NK cells. The second-generation fully human CAR consists of the anti-CD19 scFv derived from the human monoclonal antibody 21 Da (αCD19) linked to the hinge domain of human CD8a (CD8 Hinge), the transmembrane and costimulatory domains of human 4-1BB (4-1BB TMD and 4-1BB), and the signaling domain of CD3ζ. The coding sequence of human CXCR4 is connected to the CAR gene by a P2A self-cleaving peptide. Transgene expression is under control of the human elongation factor 1-α promoter (EFI-α). (B,C) NK-92 and NKL cells as well as primary NK cells were transduced with huCAR19-LV particles in the presence of polybrene and analyzed for CAR expression 3 days post-transduction by flow cytometry. The percentage of CD19-CAR-positive cells is indicated. Each transduction experiment was performed at least five times. Representative dot plots for NK-92 and NKL-transduced cells are shown in B. Individual results of transduced NK-92, NKL, and primary NK cells are shown in C as a bar diagram with mean value and SD. (D) Effect of different transduction enhancers on huCAR19 gene delivery to primary NK cells; 3 × 10⁴ primary NK cells were transduced with huCAR19-LV particles in the presence or absence of polybrene, Vectofusin-1, and Retronectin. 3 days post-transduction, huCAR19 transgene expression was detected by flow cytometry. Representative dot plots are shown (n = 2, with technical replicates). The percentage of huCAR19-positive NK cells is indicated. (E,F) Addition of human CXCR4 sequence to the huCAR19 transgene did not impact huCAR19 expression. Primary NK cells of six different donors were transduced with huCAR19-LV or huCAR19.CXCR4-LV particles in the presence of polybrene. The percentage of CD19-CAR-positive cells was analyzed by flow cytometry 3 days post-transduction. Each transduction experiment was performed at least 10 times. Three to four individually produced vector stocks were applied. Individual results as well as mean value, SD, and significance are shown in E. Representative dot plots are shown in F. ns, not significant by unpaired t test (p = 0.5245).

