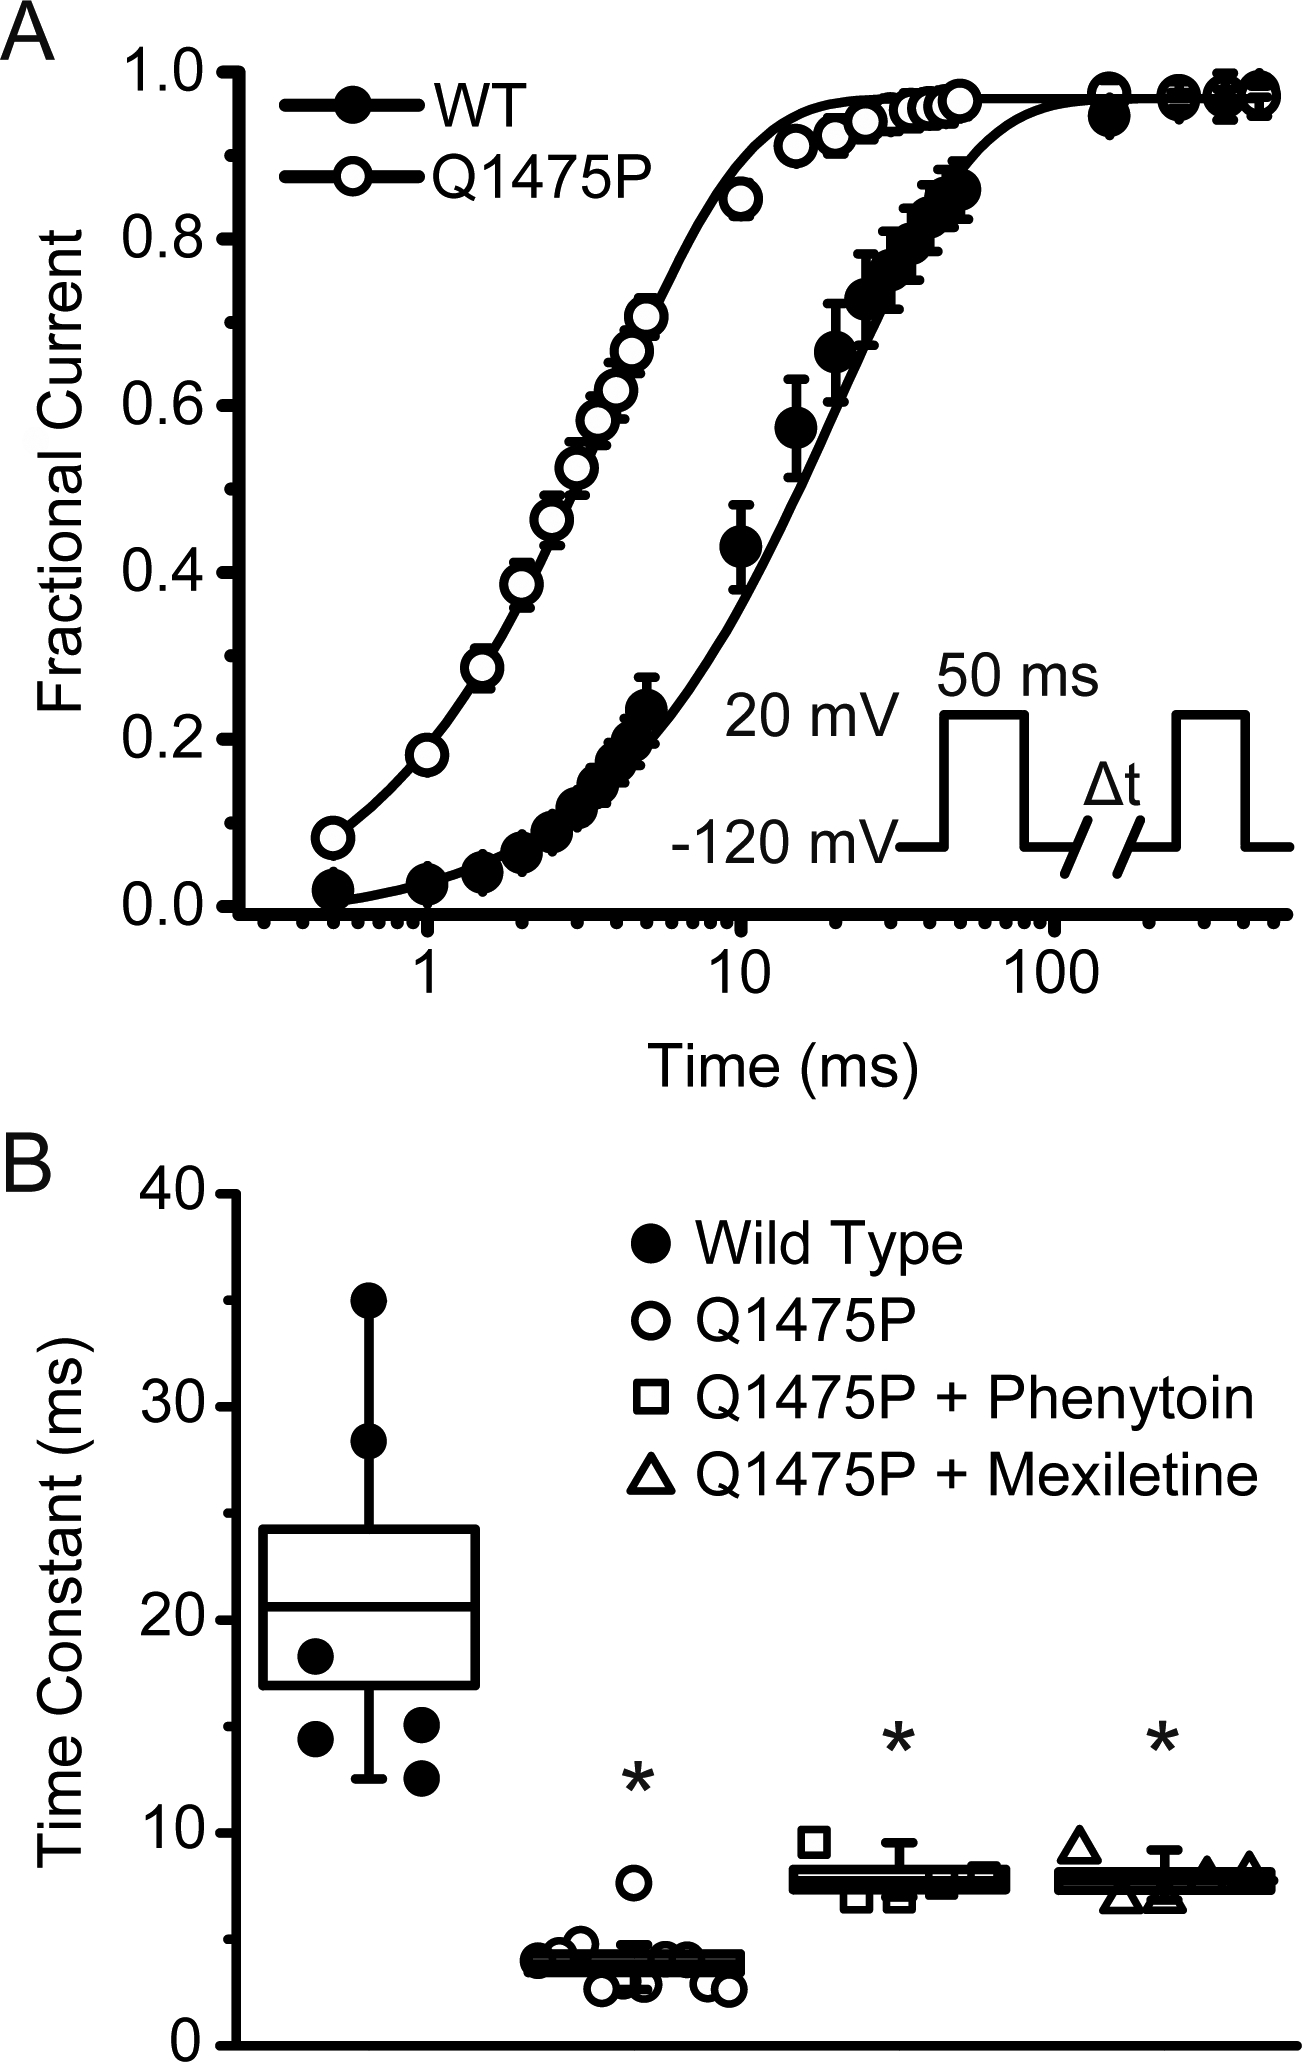
Figure 5: Recovery from inactivation of Nav1.5-Q1475P is accelerated.

(A) Recovery from inactivation was measured using a double pulse protocol (see inset). The peak current amplitude during the second pulse was normalized relative to the first, averaged and plotted as a function of the inter-pulse duration. Individual data points were subjected to curve fitting to an exponential function and the solid lines were reconstructed from the averaged fitting parameters. (B) Shown are the averaged values of the exponential time constants for the different experimental groups (WT n=6; Q1475P n=11; Q1475P plus phenytoin n=5; Q1475P plus mexiletine n=7). Phenytoin and mexiletine were each applied at 100 μM. *p < 0.05 versus WT.
