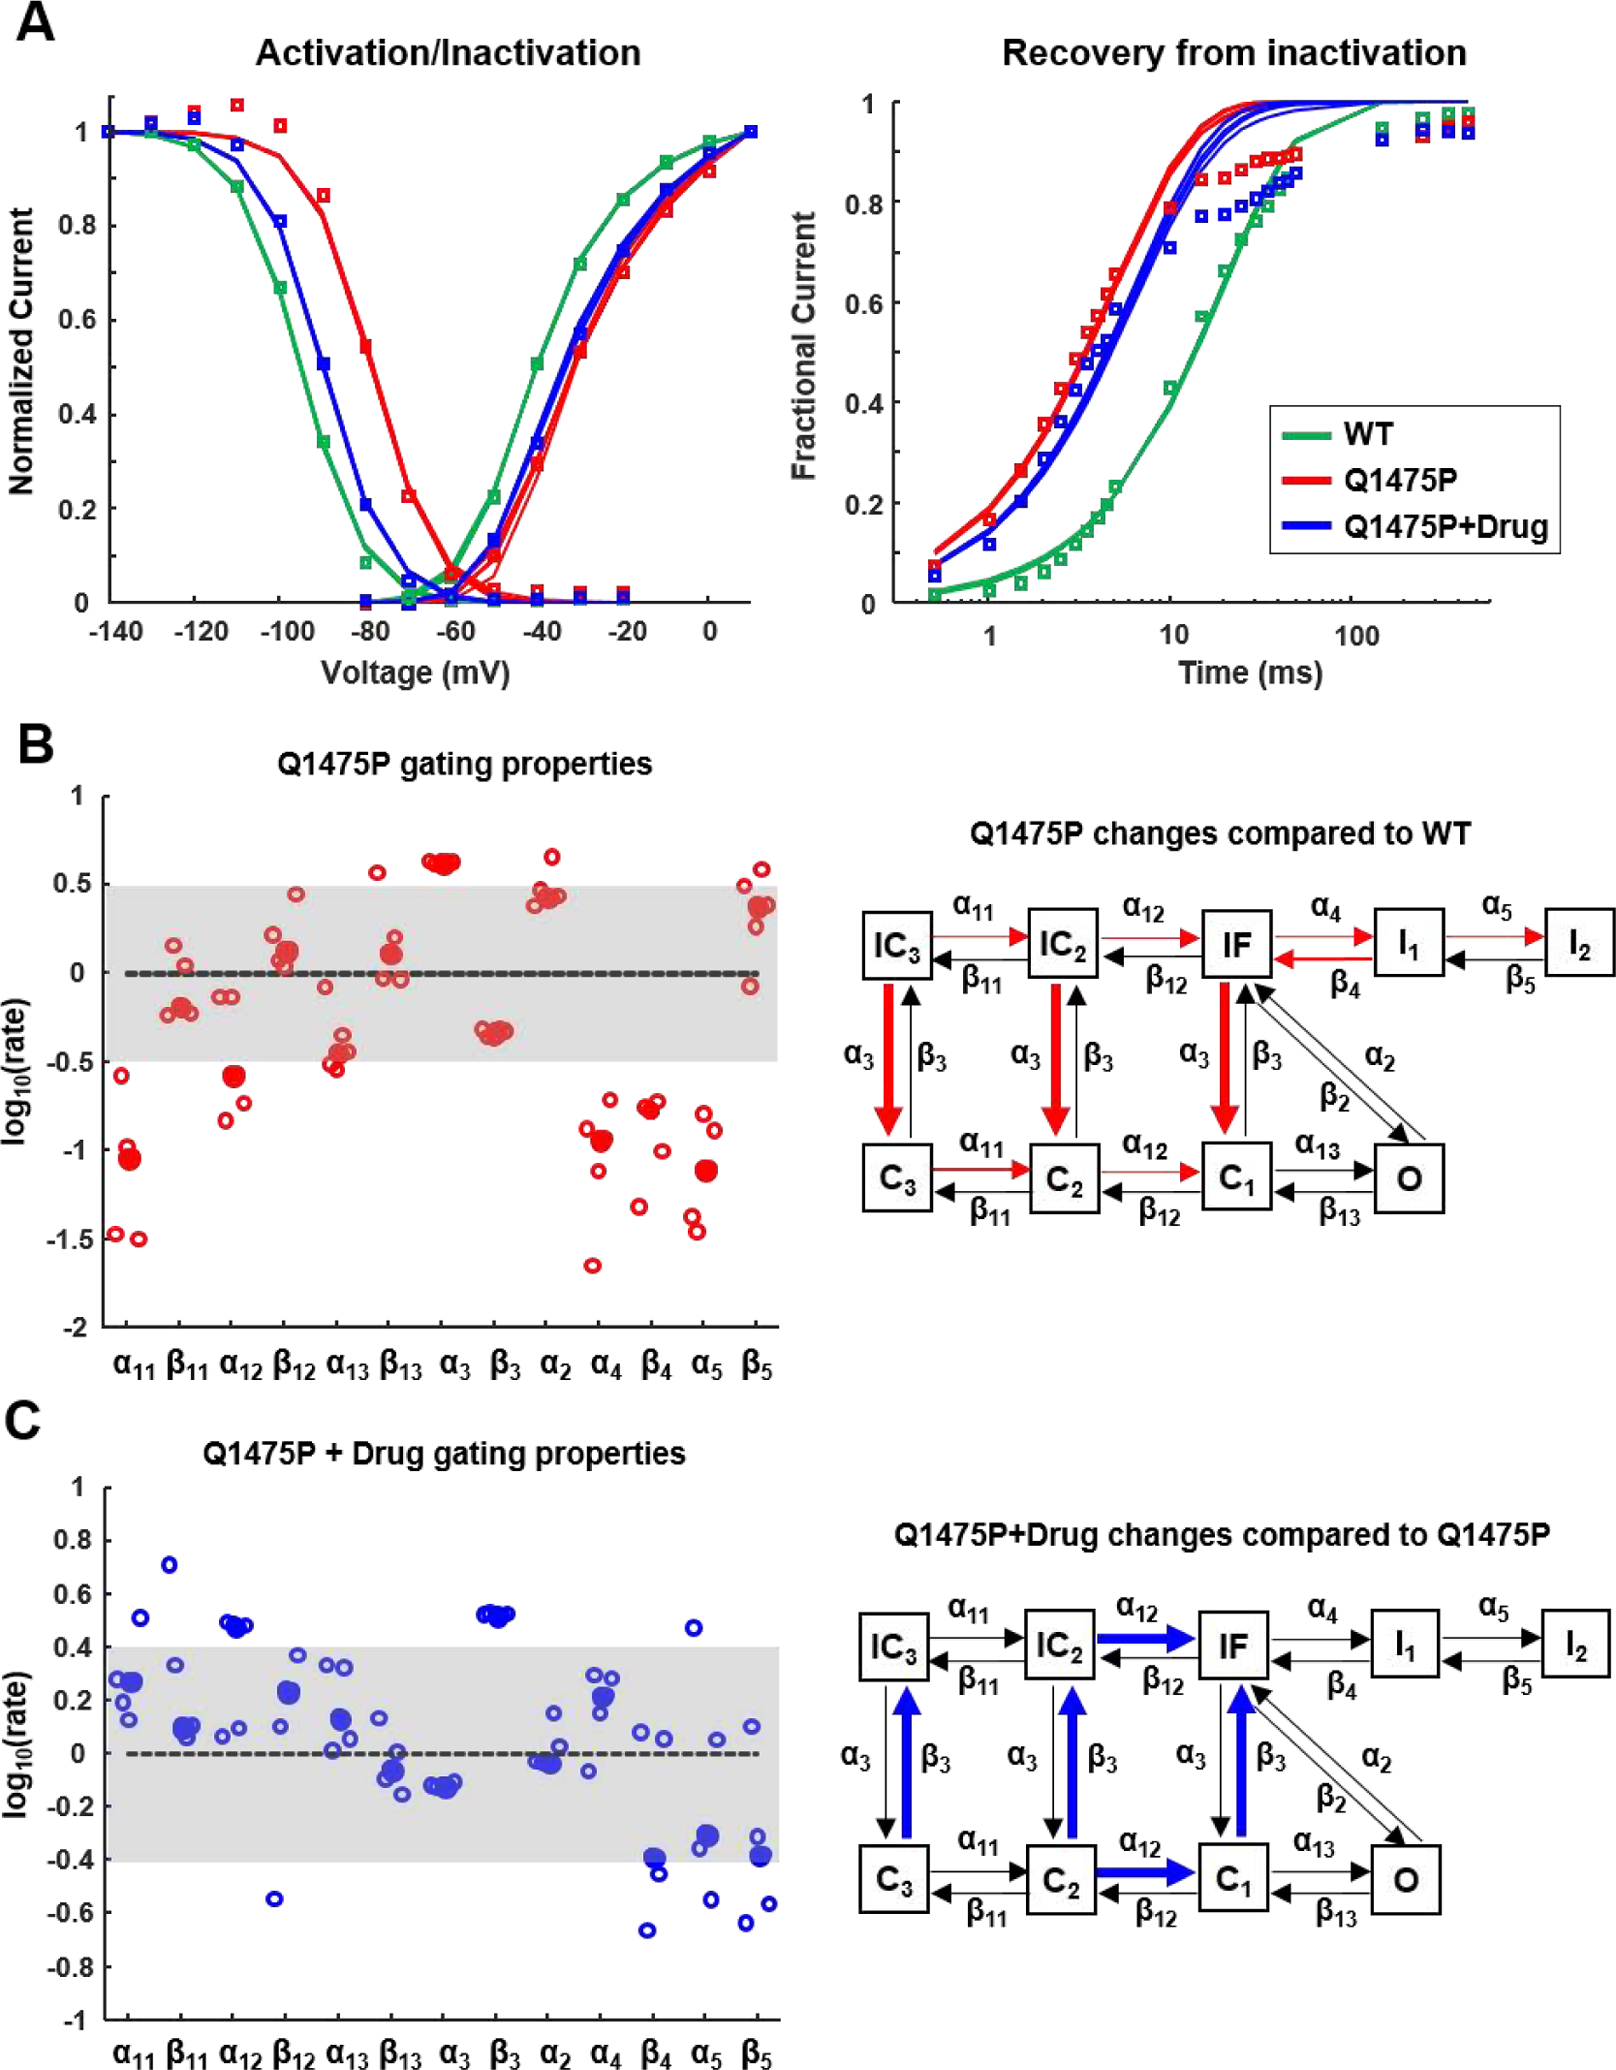
Figure 6: Modeling to infer altered gating transitions in Q1475P and drug-treated Q1475P channels.

(A) Populations of steady-state activation, inactivation and recovery from inactivation curves produced by the different parameter sets obtained with the genetic algorithm (n=5) (see Methods). The symbols show the experimental data, the solid lines are the solutions from each population. (B) Predicted changes in rate constants in Q1475P channels, compared with median WT values, are shown at left. At right, the rate constants predicted to be increased (thick lines) or decreased (thin lines) are illustrated on the Nav1.5 gating scheme. (C) Rate constants in drug-treated Q1475P channels, compared with untreated channels, displayed as in (B).
