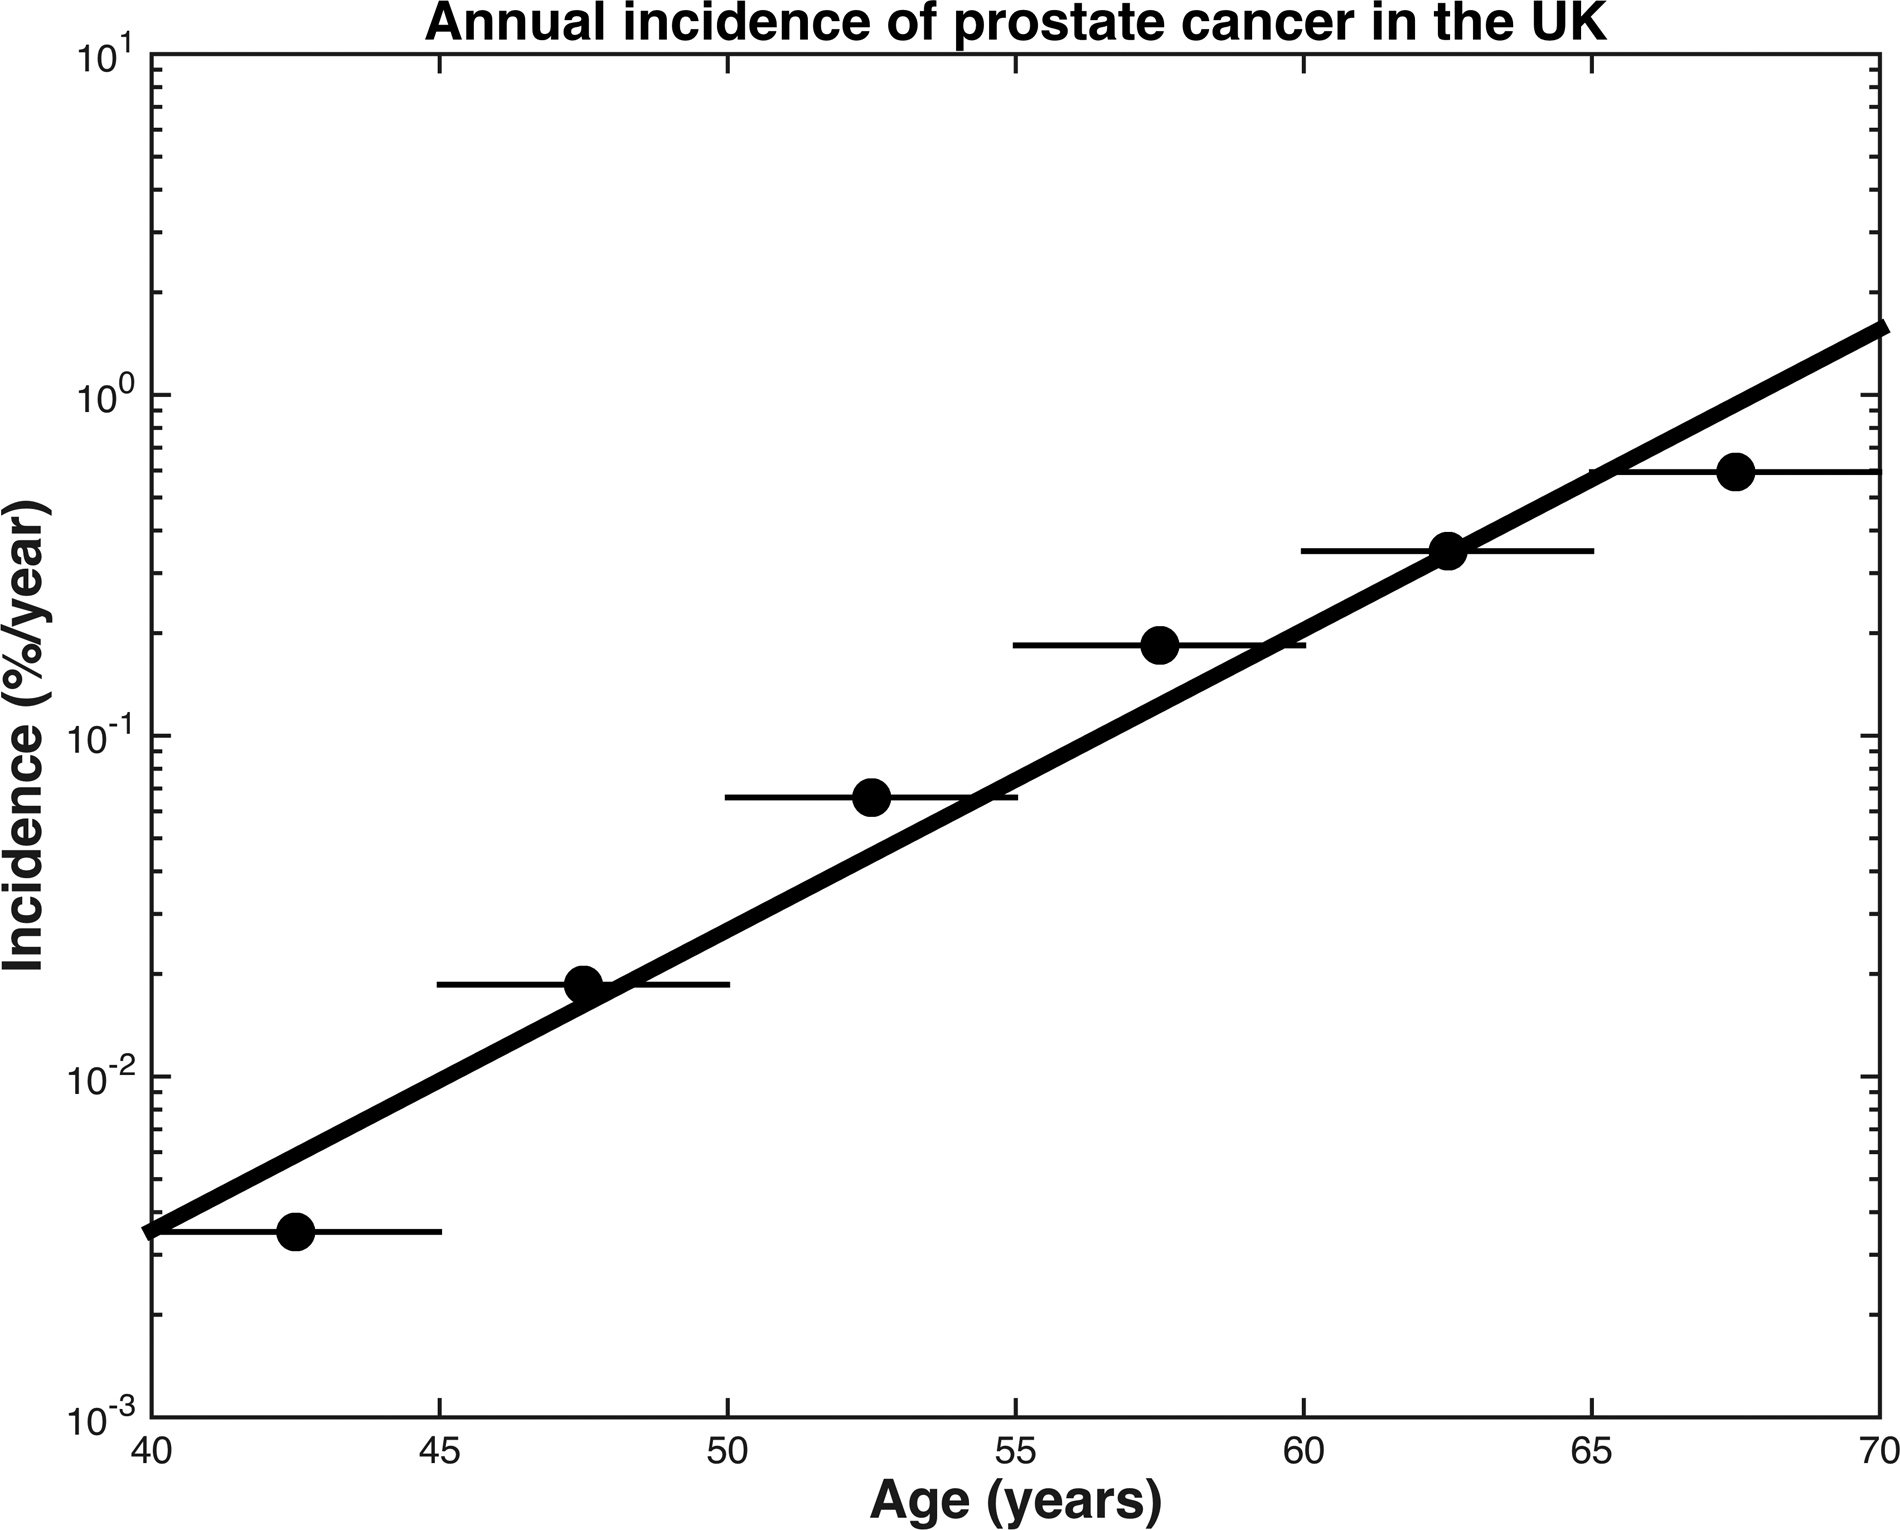
Figure 1.

Annual incidence of prostate cancer in the United Kingdom, 2013–2015. Dots represent the raw, age-specific incidence rates of each age range, per 100,000 males. The black line represents the results of linear regression for an exponential curve to give a continuous model of age-specific incidence in the United Kingdom, R2=0.96, p=0.001.
