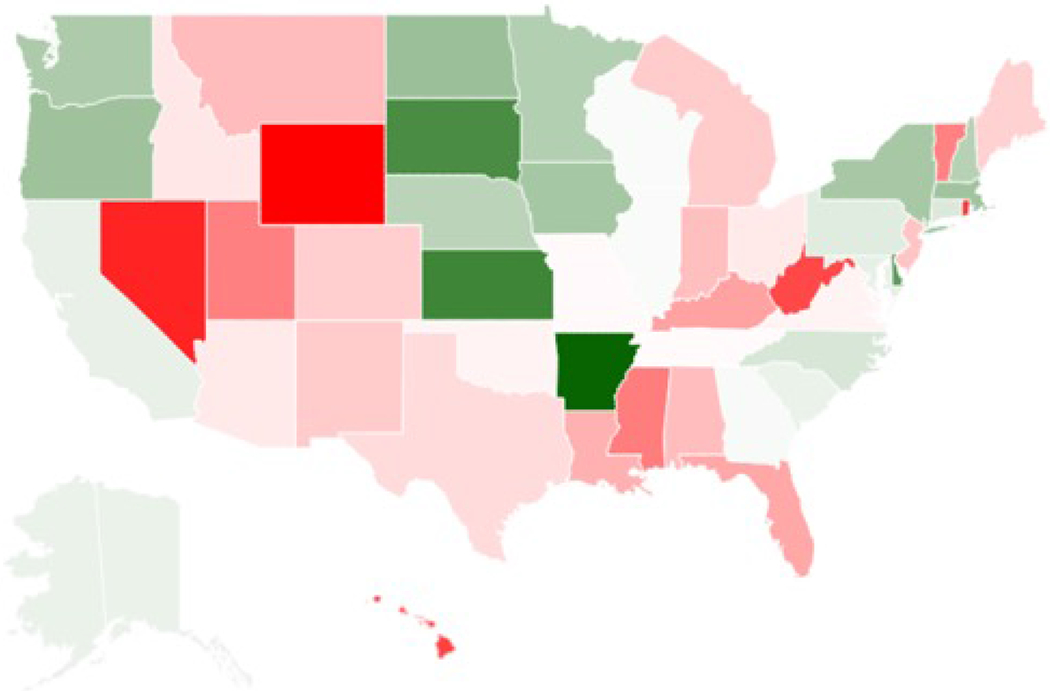
Figure 1.

Chloropleth map depicting the state-level variation in the percent of radiologist-performed non-invasive advanced diagnostic imaging in 2016 that was oncologic in nature. White corresponds with the overall national rate (9.5%), deeper shades of green correspond with increasingly higher rates above the national above, and deeper shades of red correspond with decreasing rates below the national average.
