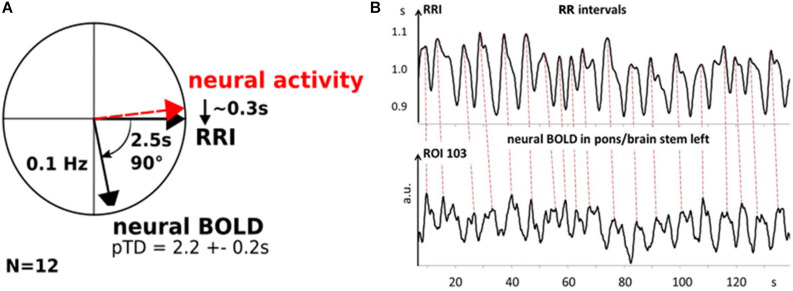
FIGURE 6.
Phasor representation of neural, RRI and BOLD oscillations from 12 subjects with a time delay of 2.2 ± 0.2 s between RRI and BOLD oscillations (A). Neural oscillatory activity leads RRI oscillations by ∼0.3 s. B: Patterns of RRI recorded from thorax and BOLD oscillations in pons/brain stem from subject 11R1. Note, RRI oscillations recorded on thorax precede those in BOLD signals in left pons/brain stem (ROI 103) by ∼2.2 s (dashed lines).

