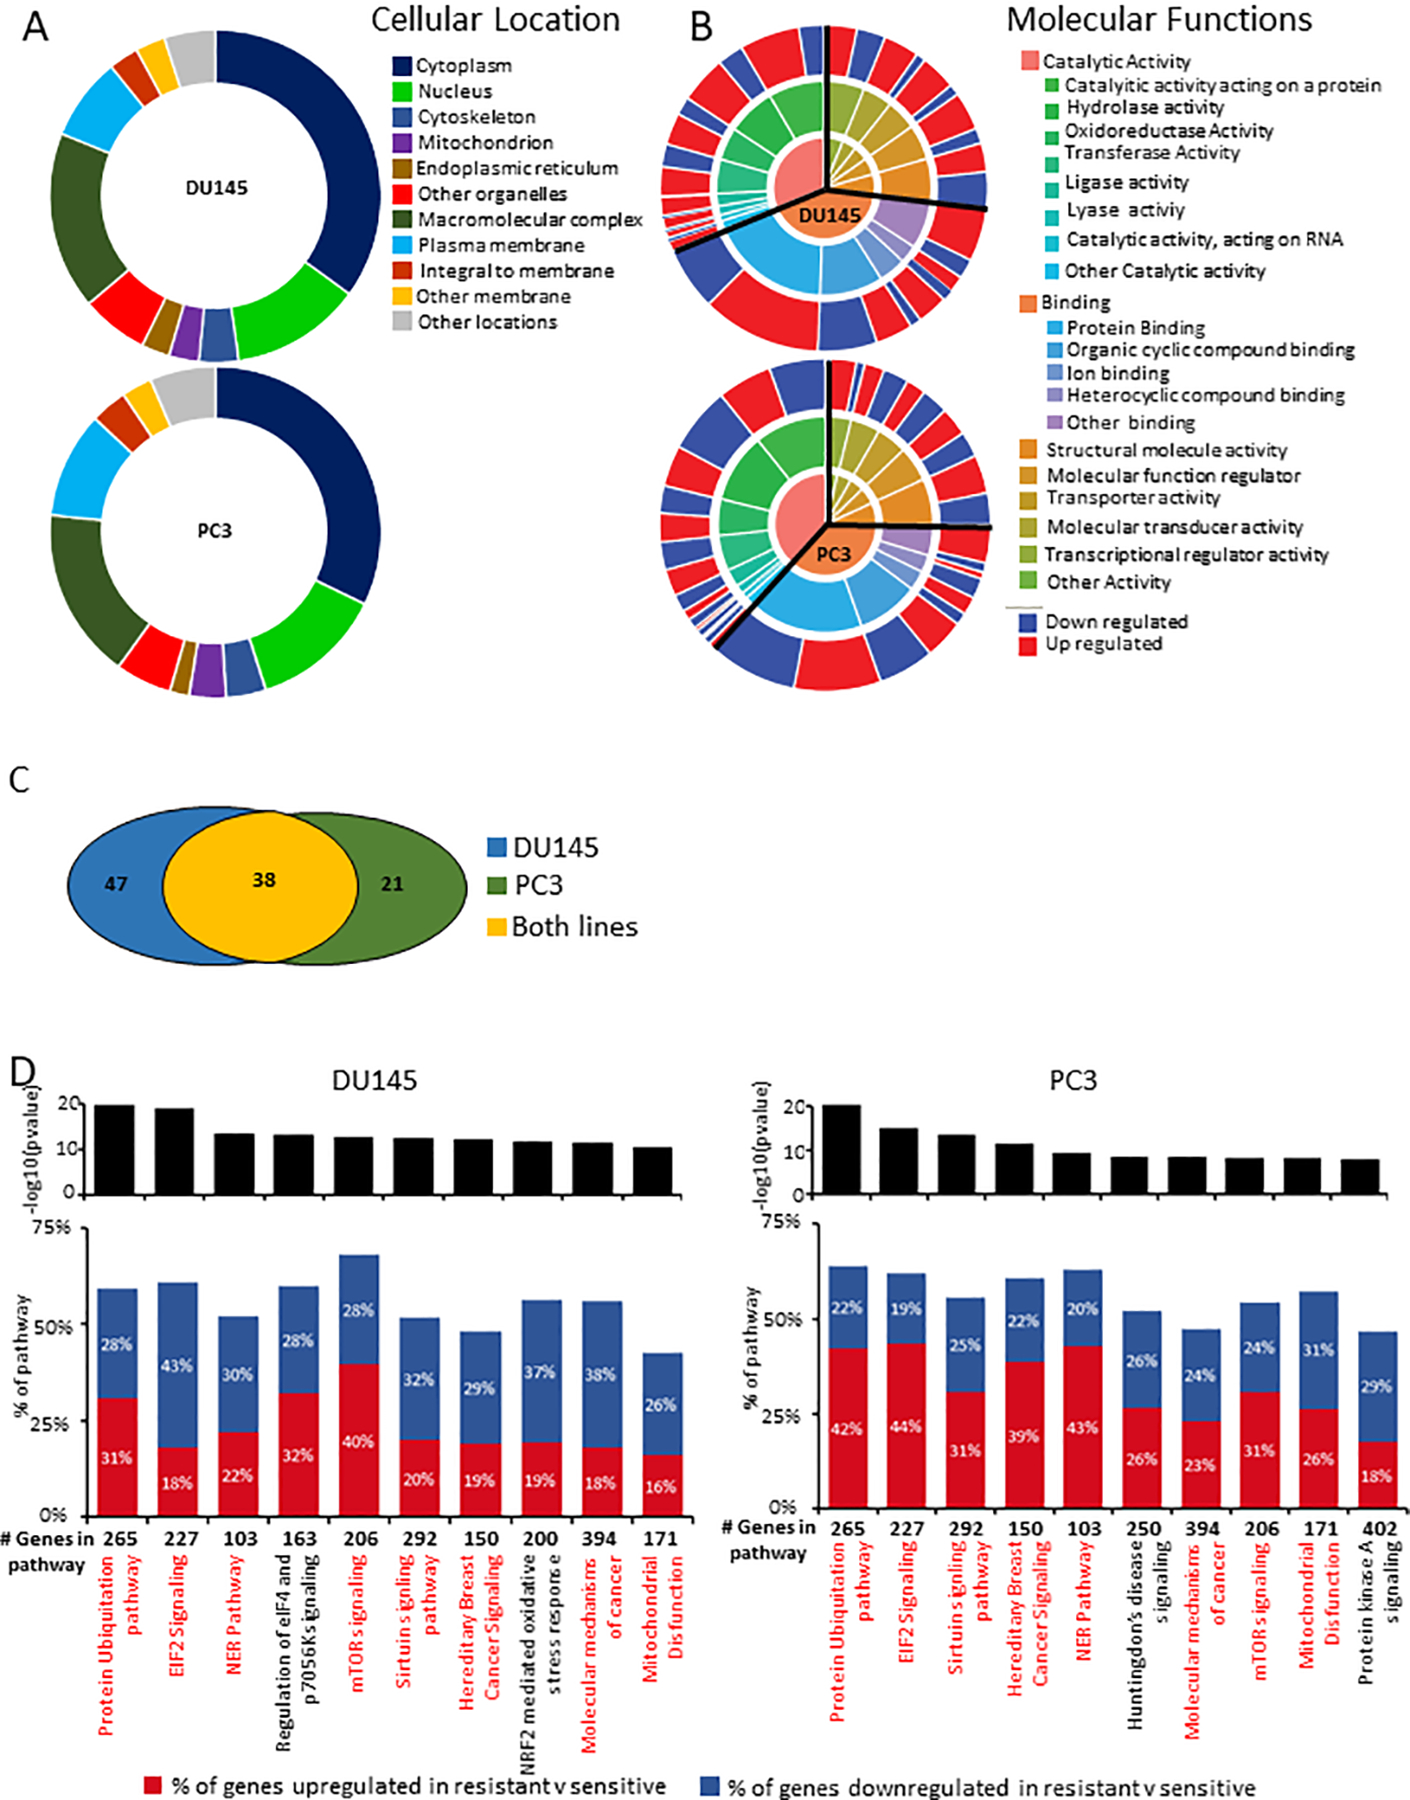
Figure 3: Functional analysis of genes involved in the acquisition of resistance.

(A) Circle diagram of distribution of the cellular compartment for differentially expressed genes in (top) DU145 and (bottom) PC3. (B) Circle diagram of distribution of molecular function for differentially expressed genes in (top) DU145 and (bottom) PC3. (C) Venn diagram of differentially regulated pathways from comparison of sensitive and resistant cell lines. (D) Top 10 pathways identified through IPA pathway analysis of (left) DU145 and (right) PC3.
