
Figure 2.
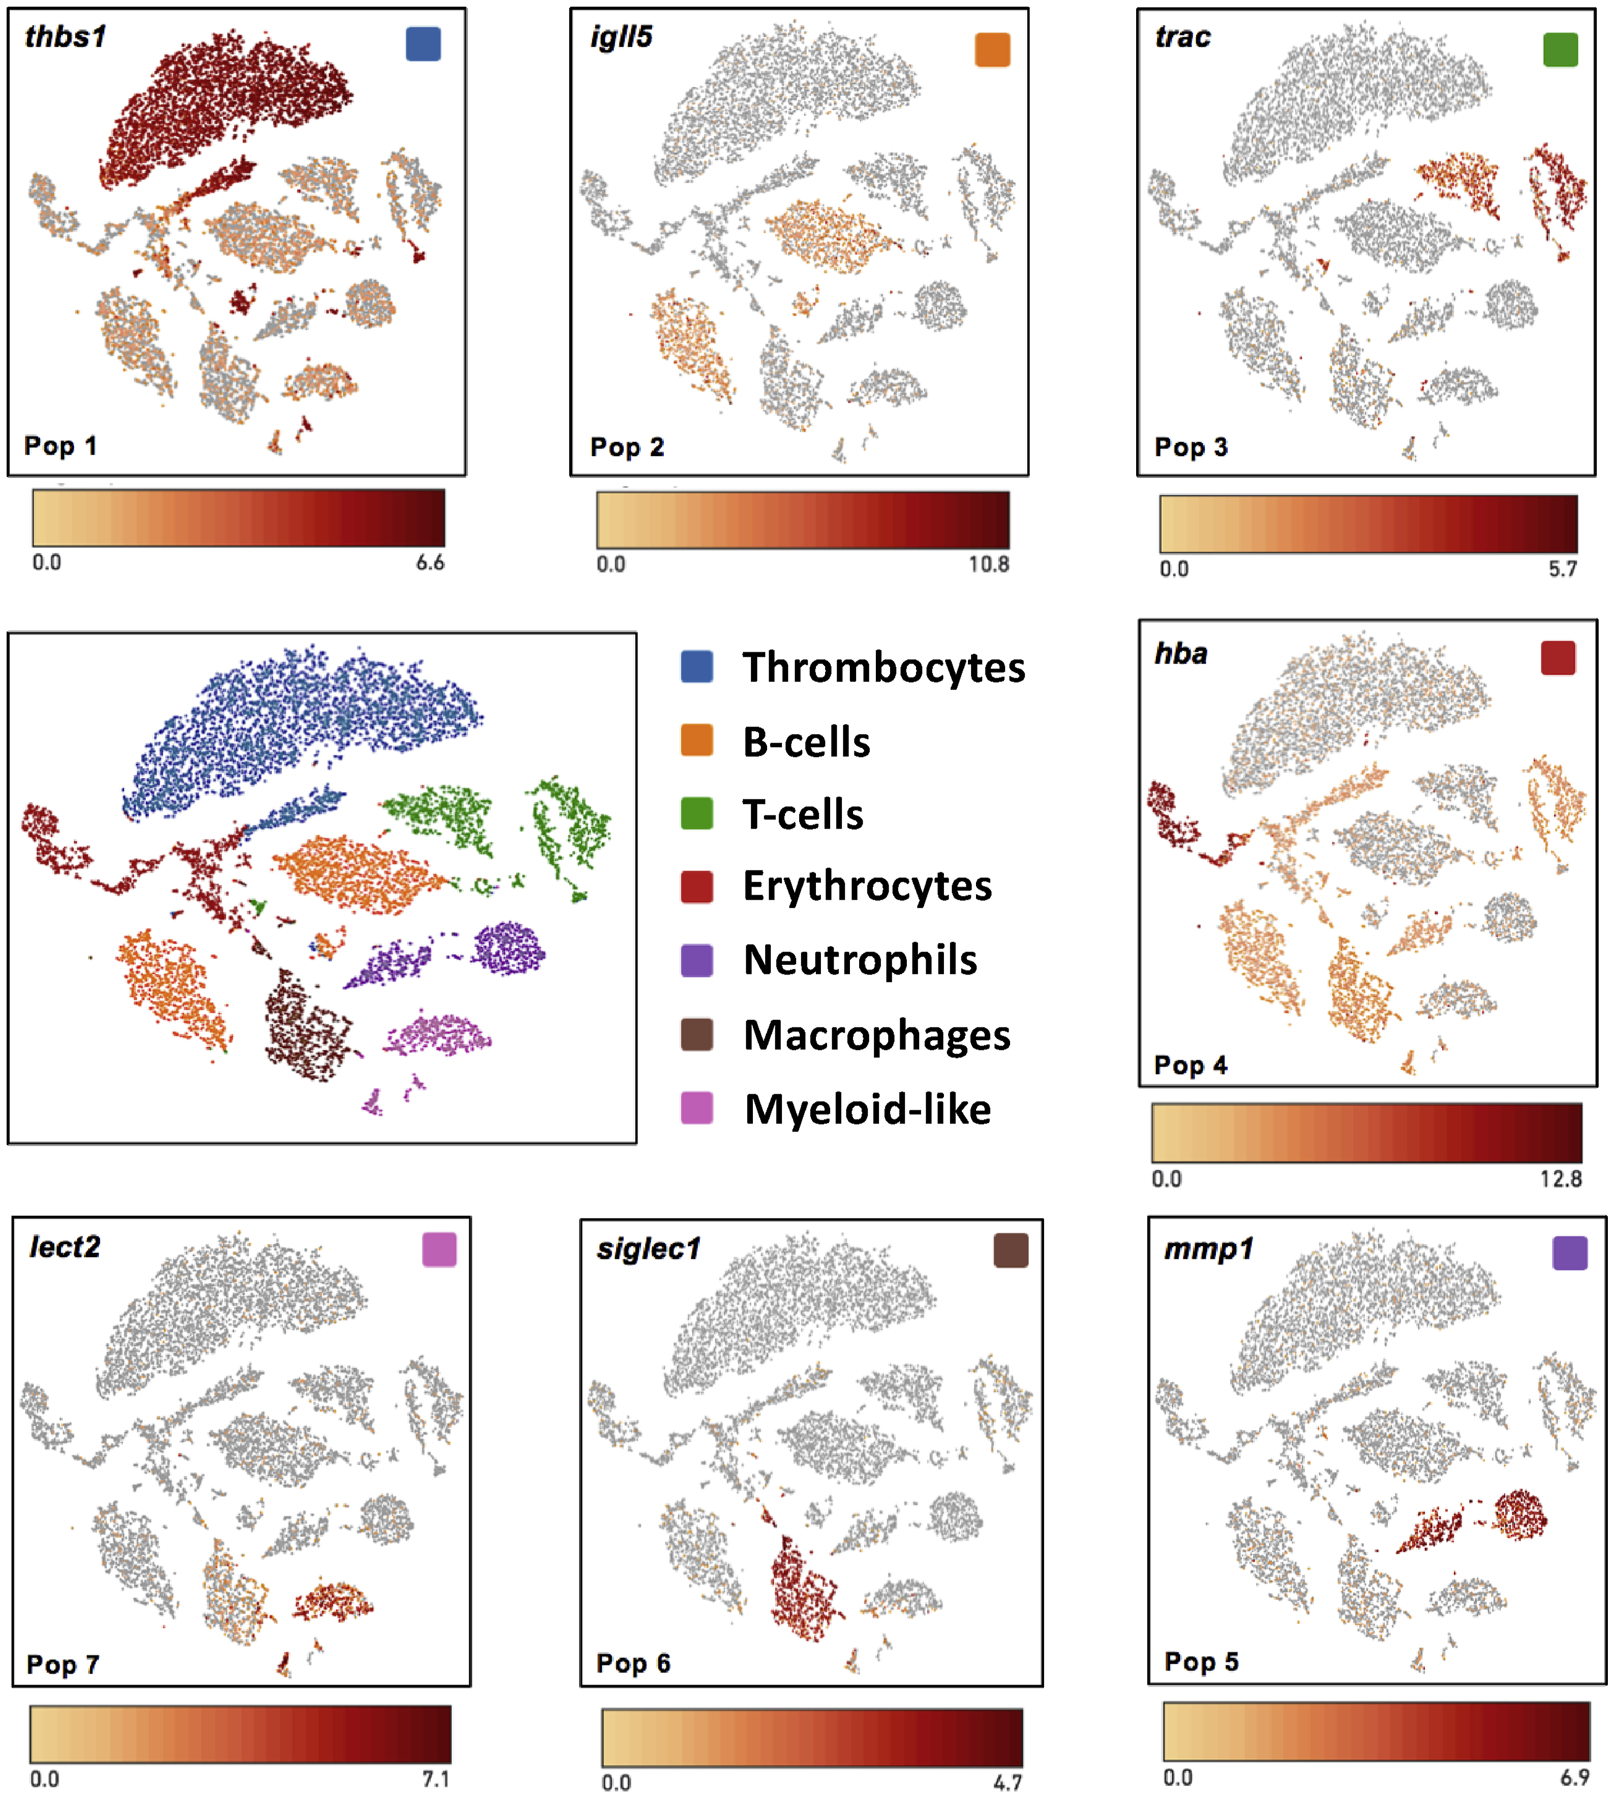
t-SNE plots showing cell populations that were identified by k-means clustering of transcripts. Example gene expression markers are shown for cell types isolated from blood and the intraperitoneal cavity.
Official websites use .gov
A
.gov website belongs to an official
government organization in the United States.
Secure .gov websites use HTTPS
A lock (
) or https:// means you've safely
connected to the .gov website. Share sensitive
information only on official, secure websites.
t-SNE plots showing cell populations that were identified by k-means clustering of transcripts. Example gene expression markers are shown for cell types isolated from blood and the intraperitoneal cavity.