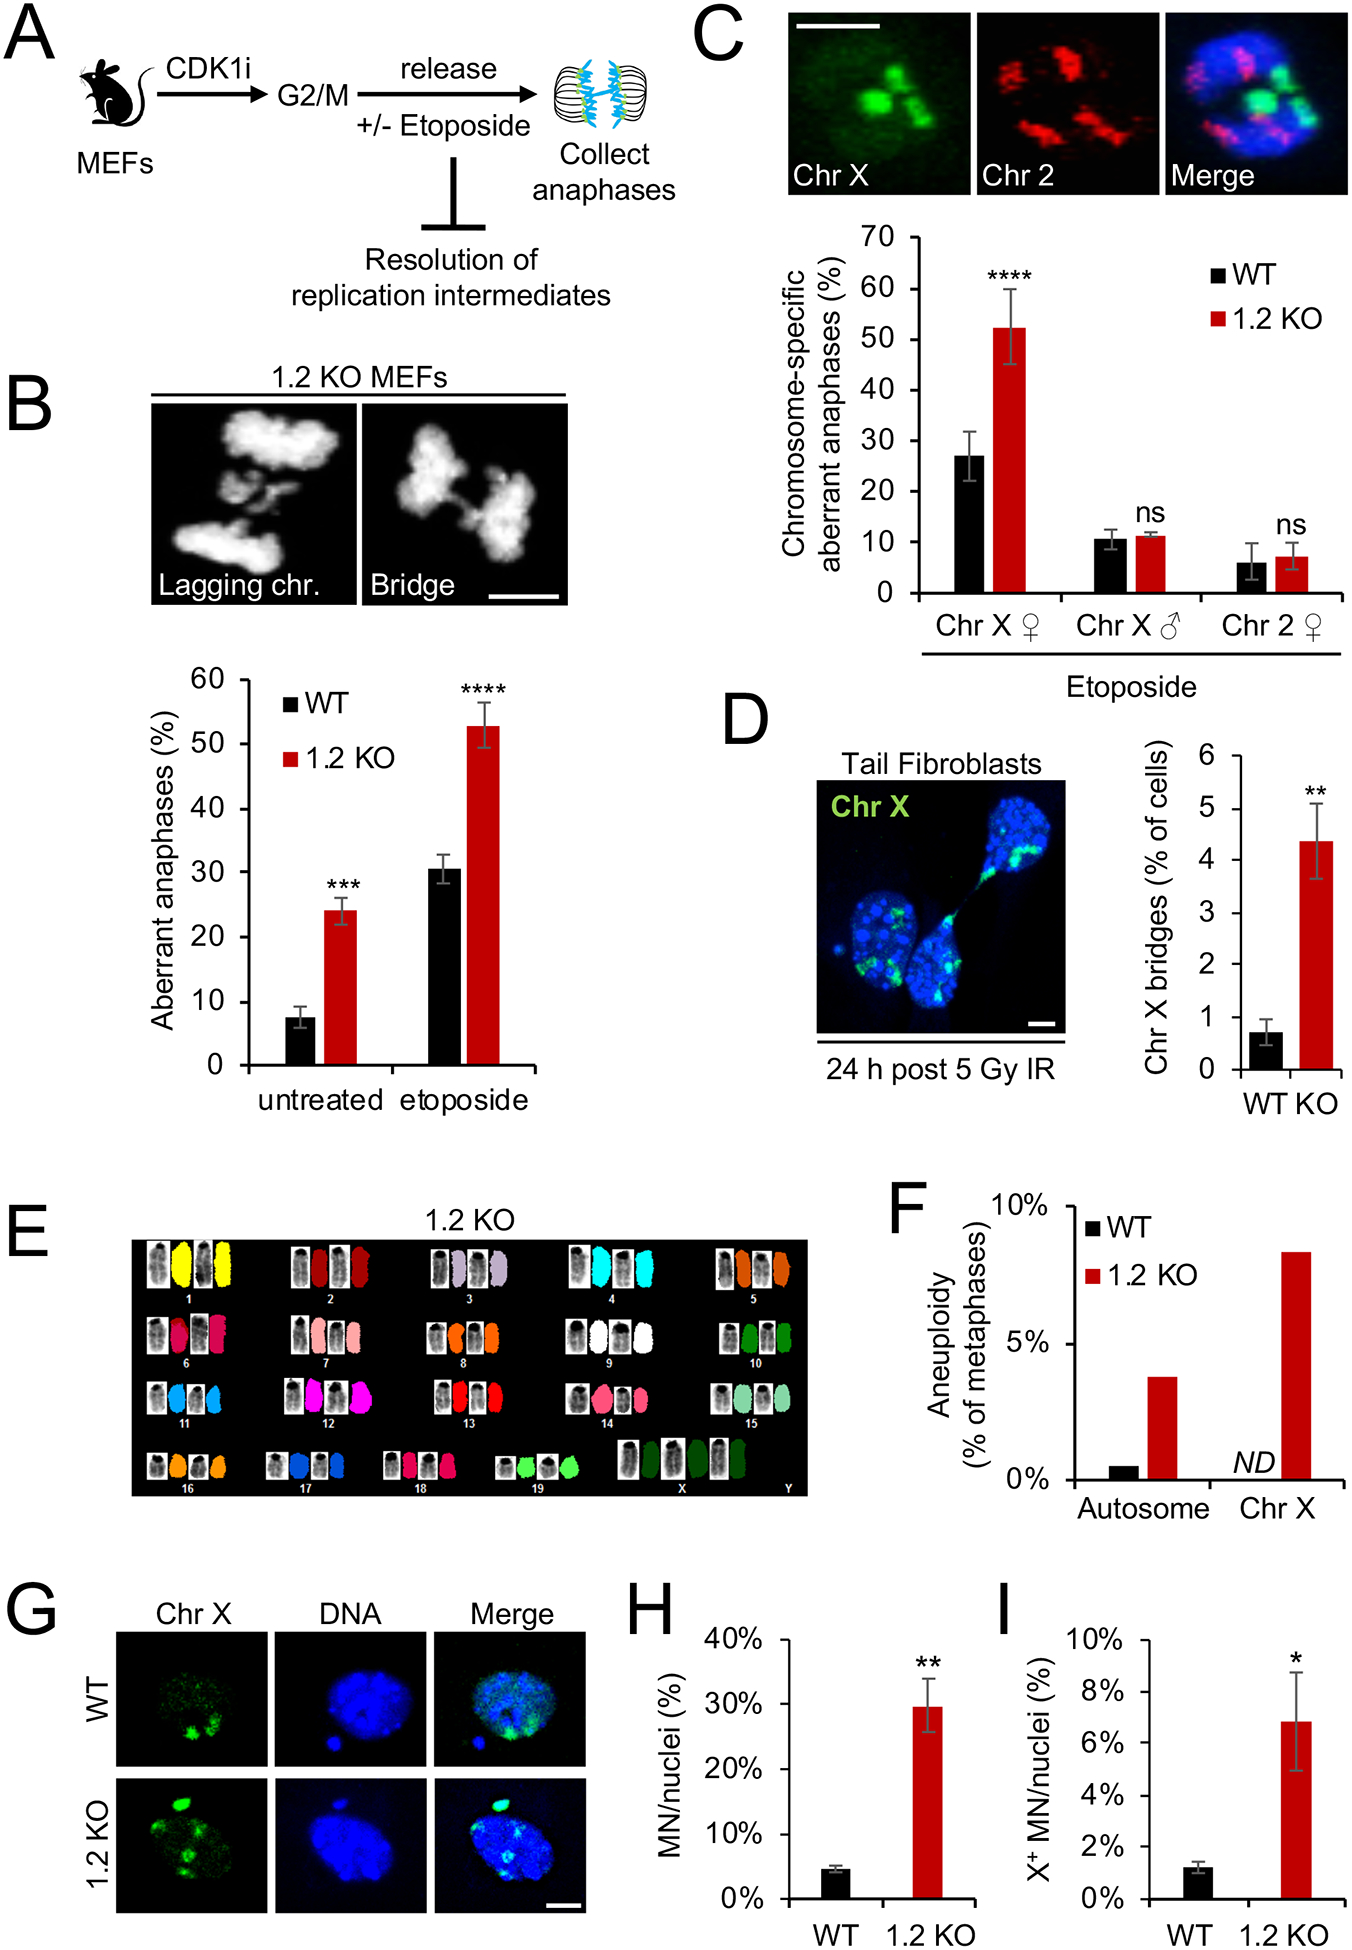
Fig. 2. MacroH2A1.2 protects from Xi-specific anaphase defects and chromosomal instability.

(A) Schematic for anaphase collection. MEFs from WT or macroH2A1.2 KO (1.2 KO) mice were arrested at G2/M via inhibition of CDK1 (CDK1i), followed by release in the presence or absence of etoposide and analysis 50 min thereafter. (B) Frequency of anaphase aberrations in WT or 1.2 KO MEFs in the presence or absence of etoposide. At least 70 metaphases were analyzed per sample, representative images for lagging chromosomes and DNA bridges are shown, scale bar: 10 μm. (C) Frequency of X or chromosome 2 specific anaphase aberrations expressed as percent of total aberrant anaphases in male or females MEFs treated with etoposide. Representative FISH images are shown, scale bar: 10 μm. At least 50 metaphases were analyzed per sample. (D) Frequency of X-chromosome bridges in asynchronous WT and 1.2 KO mouse tail fibroblasts 24 h after 5 Gy of IR. At least 100 metaphases were analyzed per sample, a representative FISH image is shown. DNA was counterstained with Hoechst 33342. Scale bar: 10 μm. (E) Representative spectral karyotype (SKY) analysis of a 1.2 KO metaphase with X aneuploidy. Chromosome-specific FISH paints unambiguously identify all 22 mouse chromosomes. (F) Frequency of autosomal or X chromosomal aneuploidy in WT (n = 34 metaphases) and 1.2 KO MEFs (n = 36 metaphases), based on SKY analysis in (E). One of two representative experiments is shown. ND: not detected. Autosomes with one or more aneuploidy events across 34 metaphases include chromosomes 1, 3, 5, 6, 8, 9, 10, 12, 13, 14, 16, 17, 19. (G) X FISH counterstained with DAPI identifies X+ micronucleus and X aneuploidy in 1.2 KO MEF nucleus. A WT nucleus with X− micronucleus is shown as a control. Scale bar: 10 μm. (H, I) Fraction of total (H) and X+ micronuclei (I) in WT and 1.2 KO MEFs following etoposide treatment, normalized to total cell number and mitotic index (see Fig. S2B). Values are expressed as mean and SD from three independent fibroblast preparations, * p < 0.05, ** p < 0.01, *** p < 0.001, **** p < 0.0001, based on Student’s two-tailed t-test.. See also Fig. S2.
