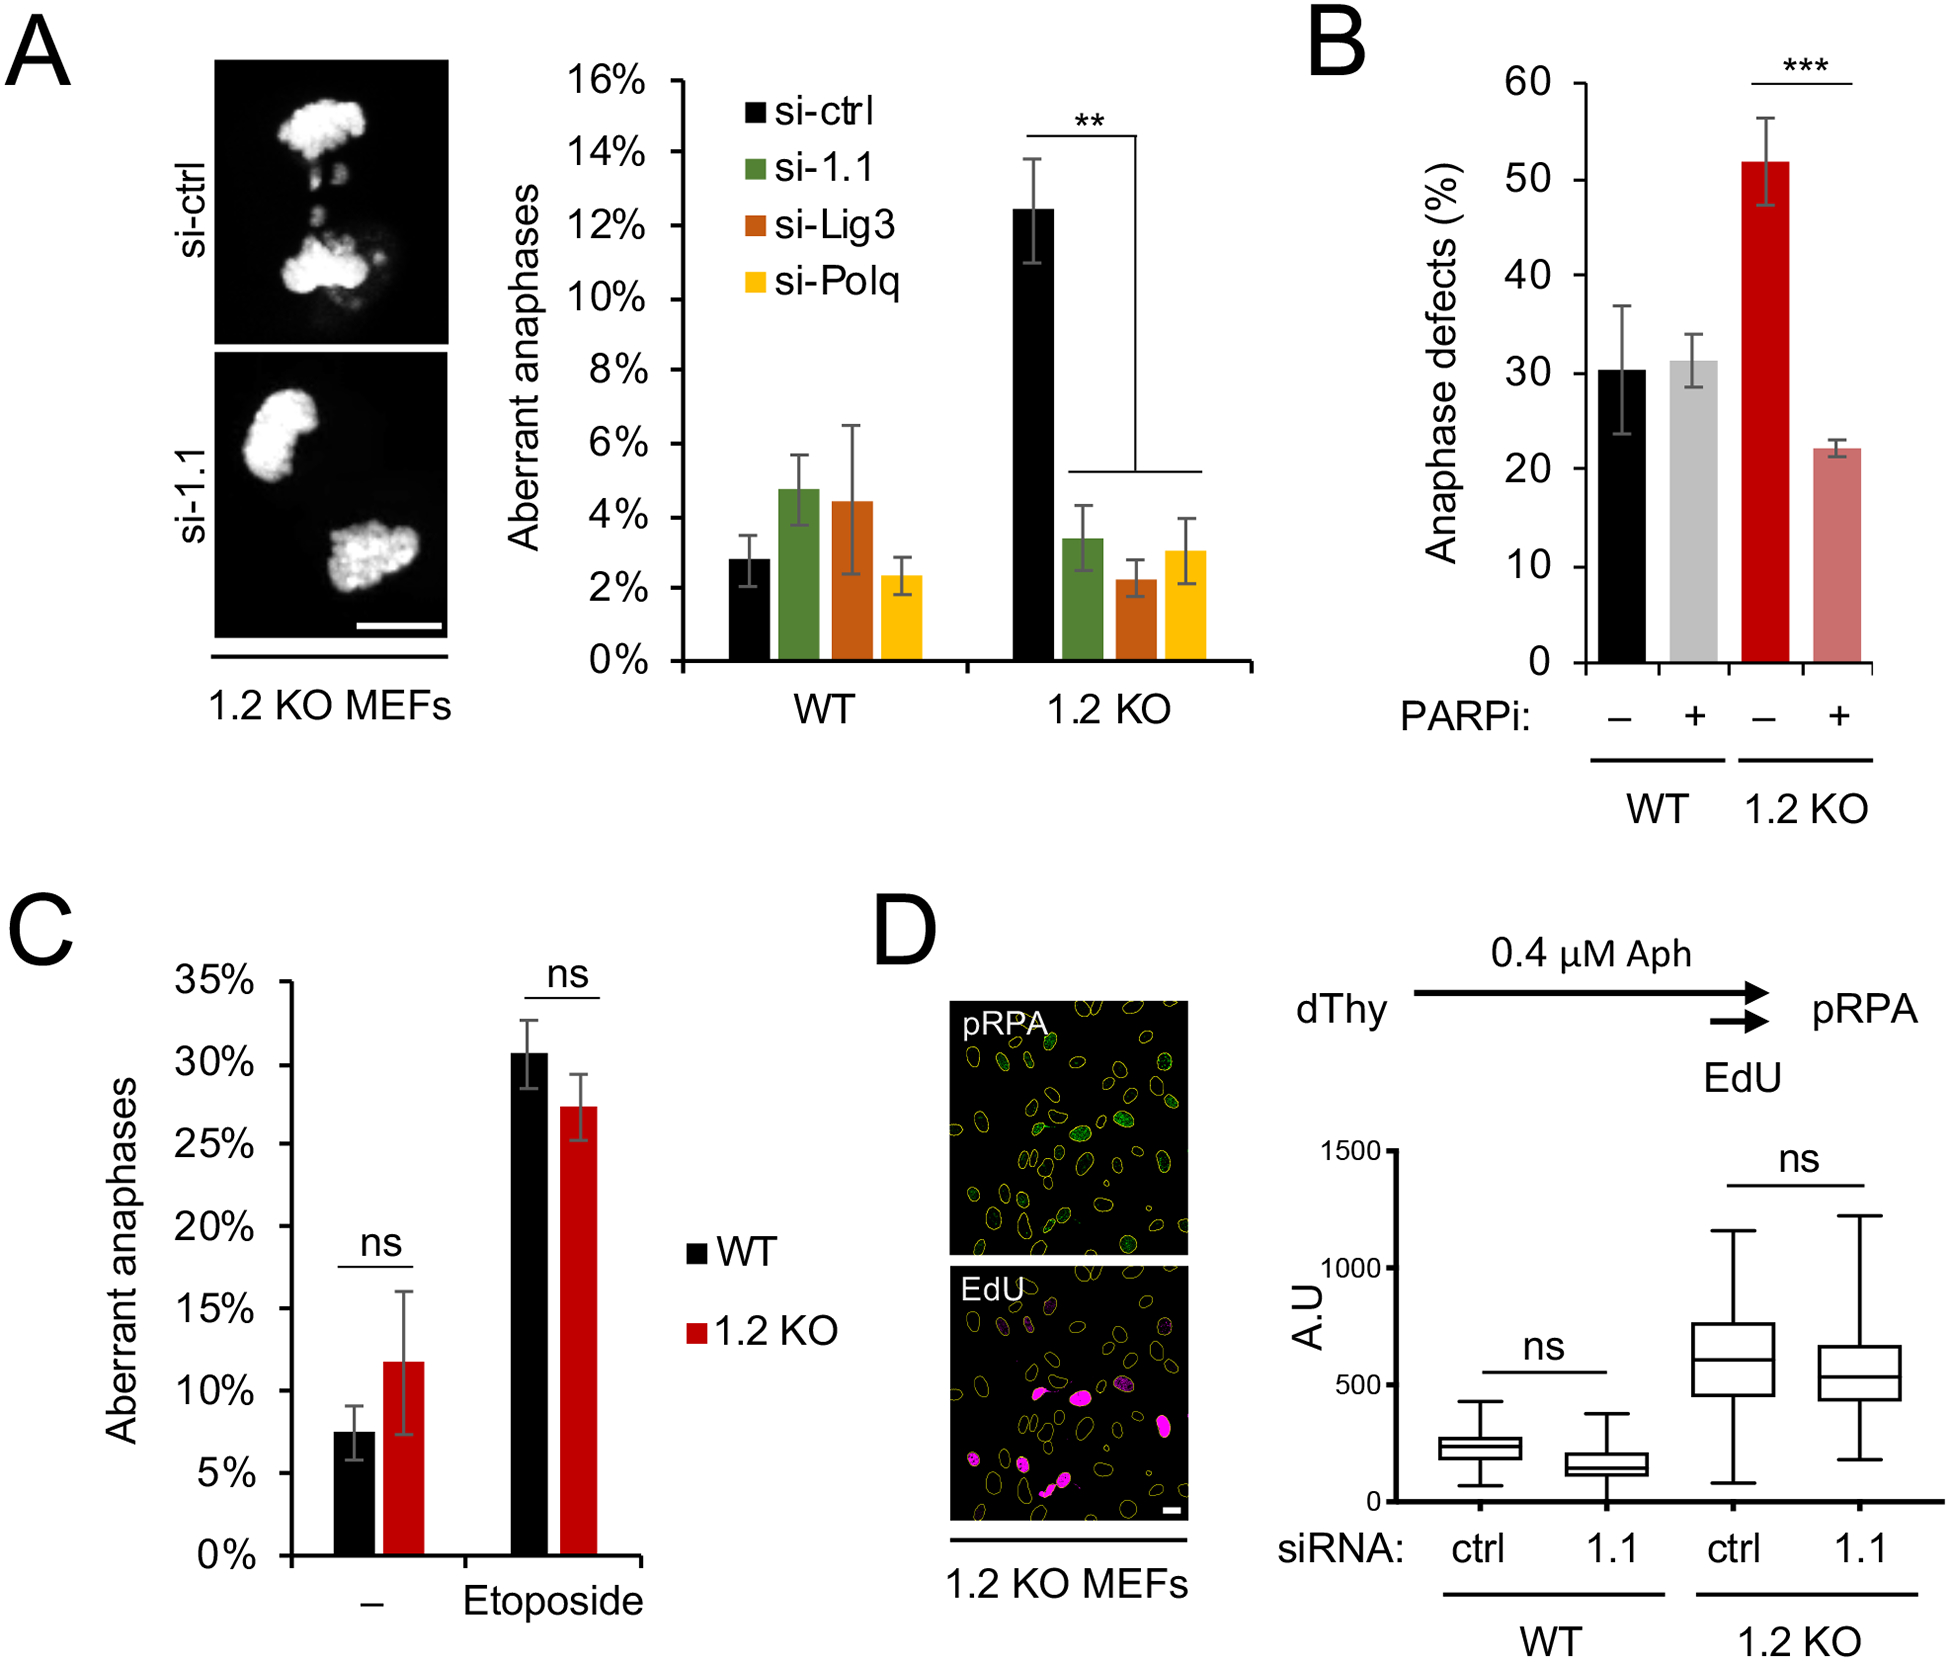
Figure 4: MacroH2A1.1 drives anaphase defects via alt-EJ upon macroH2A1.2 loss.

(A) Anaphase aberrations in WT or macroH2A1.2 KO (1.2 KO) MEFs expressing the indicated siRNAs. Anaphases were collected as described in Fig. 2A in the absence of etoposide. Values represent mean and SD (n = 3 replicates), at least 40 anaphases were analyzed per replicate and sample. Scale bar: 10 μm. (B) Fraction of anaphase aberrations in etoposide-treated WT and macroH2A1.2 KO MEFs in the presence or absence of PARP inhibitor (PARPi). Values represent mean and SD (n = 3 replicates, > 60 metaphases per replicate). (A, B) ** p < 0.01, *** p < 0.001 based on Student’s two-tailed t-test. (C) Fraction of anaphase aberrations in MEFs from macroH2A1 KO mice (Changolkar et al., 2007) in the presence or absence of etoposide. Values are expressed as mean and SD (n = 3 replicates, >50 metaphases per replicate), ns: not significant. (D) pRPA intensity in EdU+ MEFs. Representative images are shown, scale bar: 20 μm. ns: not significant based on ANOVA with multiple comparison assuming non-Gaussian distribution. See also Fig. S4.
