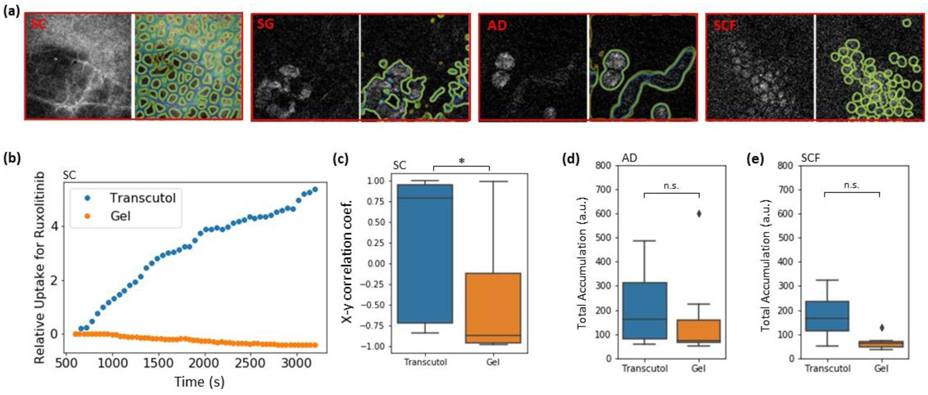
Figure 11.

(a) SRS images of SC, SG, AD and SCF layers in mouse epidermis (on the left side of each red box) and segmentation of the lipid-rich areas using 4 in-house-trained U-Net algorithms (on the right side of each red box). (b) Relative uptake of ruxolitinib over time in transcutol and a gel formulation in the lipid-rich regions of an SC image. (c) Pearson’s correlation coefficient for 10 uptake patterns similar to what is shown in (a) for both ruxolitinib and BMDP-D in transcutol and gel showing a statistically significant difference between the two vehicles. (p < 0.05). (d, e) AUC calculated for the same experiments as in (c) but for the AD and SCF shows a non-significant difference between the two vehicles. Taken from [195] with permission.
