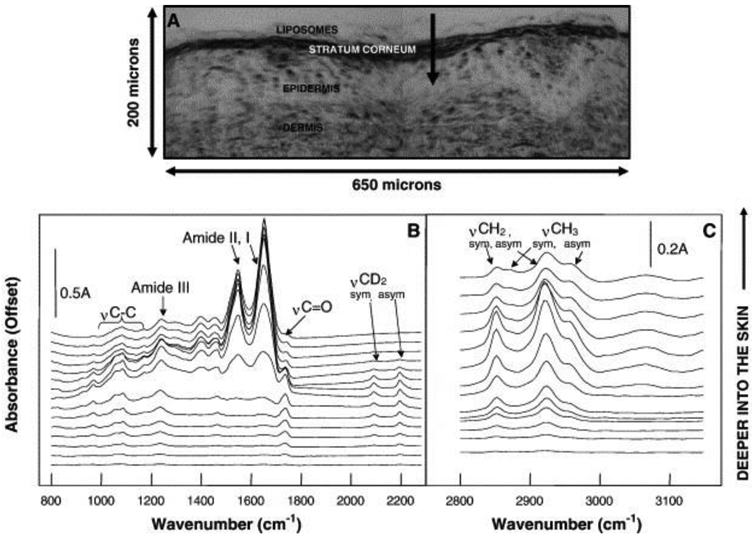
Figure 8.

IR spectroscopy for drug delivery in skin. A) Histological section of unstained pig skin where deuterated phospholipids were topically applied before imaging. The outer dark line shows the stratum corneum, the arrow starts in the topically applied formulation and goes towards the dermal layers of the skin. IR spectra recorded along the arrow (superficial spectra depicted at bottom) are shown in B) and C). For spectra close to the tip of the arrow (upper spectra) the typical skin signature becomes visible with strong Amide I and II vibrations from keratin, while the prior spectra obtained on the surface of the skin exhibit signal from the symmetric and asymmetric stretching CD2 modes from the exogenous P-d31OPC liposomes at approx. 2090 and 2190 cm−1. Reprinted with permission from [112].
