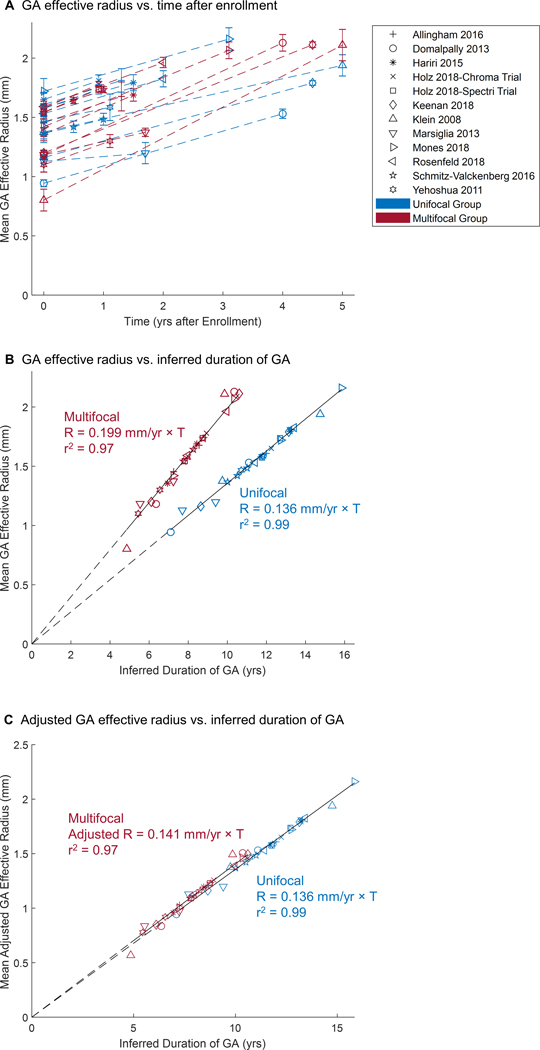
Figure 10.
Geographic atrophy (GA) effective radius as a function of time in unifocal and multifocal groups. The shape of the markers represents the corresponding study, while the color represents the unifocal or multifocal group. The points in (A) represent reported raw data in prior publications (error bar = standard errors). Note that the initial GA radius ranged from 0.802 to 1.721 mm (2.02 to 9.30 mm2 in area) among all studies, suggesting that patients were entered at different time points of disease. The data in (B) were generated by adding a horizontal translation factor (expressed in years in Table 3, available at http://www.ophthalmology-retina.org) to each data subset to correct for different entry times of patients into each clinical trial. The translation factors were determined using a custom optimal realignment algorithm. The cumulative datasets in both unifocal and multifocal group fit along a straight line with a very high r2, suggesting that the GA effective radius enlarges linearly over a course of 7 years in both groups. Note, the radius growth rate of multifocal GA (0.199 ± 0.012 mm/year, r2 = 0.97) was 46.3% faster than the radius growth rate of unifocal GA (0.136 ± 0.008 mm/year, r2 = 0.99) (P < 0.001). C, Interestingly, the difference in the effective radius growth rate between unifocal and multifocal groups disappears after dividing the effective radius of multifocal GA by a factor of .

