Figure 4.
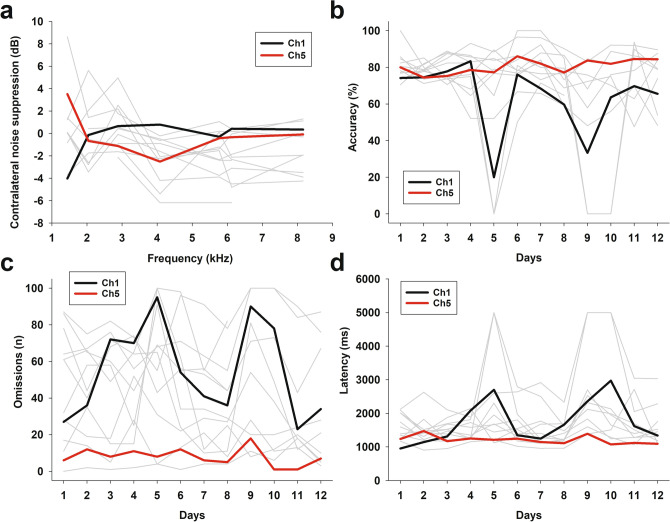
MOC reflex strength and behavioural performance at the individual level (a) Contralateral noise suppression of DPOAE at different frequencies. Gray traces show data for each animal, evidencing individual variability of the MOC reflex strength (n = 13). Traces for two chinchillas (Ch1, Ch5) are coloured as examples of: (i) an average MOC reflex (red traces), and (ii) an almost absent MOC reflex (black traces) at 4 kHz. (b–d) Individual performance (gray traces) during the behavioural protocol, showing (b) accuracy, (c) omissions, and (d) latency of correct responses. Note that the chinchilla with an almost absent reflex at 4 kHz (Ch1, black traces) was severely affected by auditory distractors, with reductions in accuracy, increased omissions and longer latencies during BBN1 and VOC1 (days 5 and 9). On the other hand, the chinchilla with an average MOC reflex strength at 4 kHz (Ch5, red traces) was barely affected by the auditory distractors.

