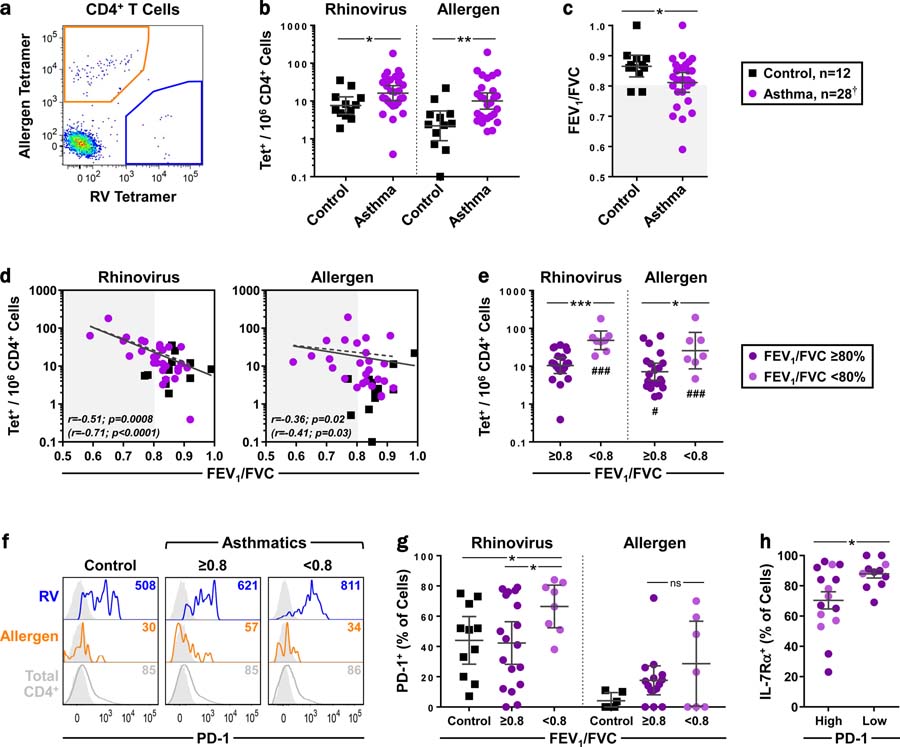
Figure 1. Activated PD-1+ RV-specific T cells are linked to asthma in the absence of infection.
(a) Representative plot of antigen-specific cells in an uninfected asthmatic. (b) Comparison of RV-specific and allergen-specific T-cell numbers in uninfected asthmatics and controls (geometric mean [GM] ± 95% CI, Mann-Whitney). (c) Comparison of FEV1/FVC between groups at the time of subject screening (GM ± 95% CI, Mann-Whitney). Shaded region denotes decreased lung function73. (d) Spearman correlation between antigen-specific T cell-numbers and FEV1/FVC. Dashed regression lines and values in parentheses depict asthmatics only. (e) Numbers of antigen-specific T cells in asthmatics, classified by lung function (GM ± 95% CI, Kruskal-Wallis). #Compared with healthy controls in panel b. (f) Representative histograms of PD-1 expression on antigen-specific T cells, with FMO controls (grey). Values denote geometric mean fluorescence intensity (MFI). (g) Percentage of PD-1+ antigen-specific T cells, by lung function. Samples with low cell counts were excluded from analyses (mean ± 95% CI, Kruskal-Wallis). (h) Expression of IL-7Rα on PD-1high (≥50% positive) and PD-1low (<50% positive) RV-specific T cells in asthmatics (mean ± 95% CI, Mann-Whitney). Panels e, g, & h: Light purple symbols indicate asthmatics with worse lung function. *p≤0.05, **p≤0.01, ***p≤0.001 (#p≤0.05, ###p≤0.001). † n=27 for allergen-specific cells.

