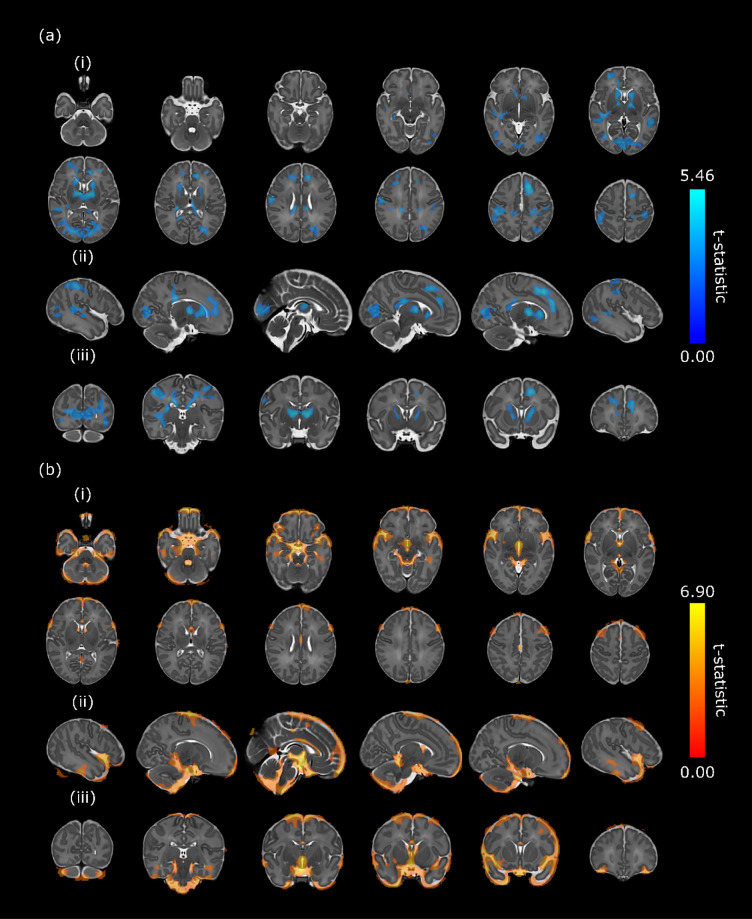
Figure 1.
Map of t-statistic values of areas of significant (a) reductions and (b) expansions in volumes in infants with congenital heart disease compared to healthy controls (family-wise-error-corrected p < 0.025). Images in 3 planes are shown: (i) axial, (ii) sagittal, (iii) coronal. t-statistic range is shown on the colour bars. Results are overlaid on the template image with post-menstrual age at scan of 40 weeks. Left–right orientation follows radiological convention. Sagittal views are presented from right to left.

