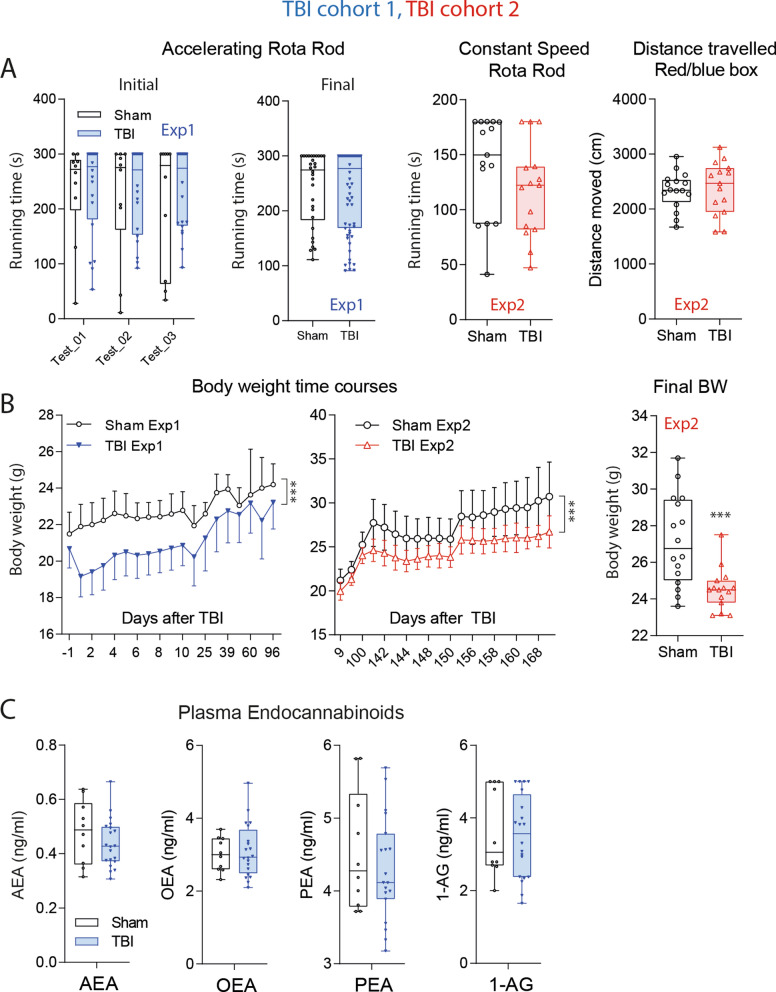
Figure 2.
Motor functions and general well-being in TBI versus sham mice in a controlled cortical impact model. (A) Box/scatter plots showing running times in rotarod trials with accelerating speed or constant speed in experiment-1 with TBI/sham cohort-1 (blue) and experiment-2 with TBI/sham cohort-2 (red). Initial tests were done 10–14 days after TBI before tests of nociception and cognition. Final rotarod runs were done after completion of IntelliCage experiments 3 months (Exp1) or 6 months (Exp2) after surgery. The right panel shows the distance traveled in the red/blue box. The box shows the interquartile range, the line is the median; the whiskers show minimum to maximum, each scatter is a mouse. In 'Final-Exp1’ each mouse is represented with 2 trials. (B) Time courses of the body weights (means ± SD) in TBI and sham mice up to 35 days after surgery in Exp1 (blue, n = 10 sham, n = 21 TBI) and up to 170 in Exp2 (red; n = 15 both groups). Asterisks indicate significant differences between groups (2-way ANOVA for time courses, factor "group", 2-sided independent T test for comparison of final body weights, ***< 0.001; P adjusted according to Šidák for comparison of individual time points). (C) Plasma concentrations of endocannabinoids: anandamide AEA, oleoylethanolamide, OEA, palmitoylethanolamide, PEA and 1-arachidonoylglycerol, 1-AG in TBI/sham mice of cohort-1 at the end of the observation 101 days after surgery. The box shows the interquartile range, the line is the median; the whiskers show minimum to maximum, each scatter is a mouse. Concentrations did not differ significantly between groups. Graphs were created with Graphpad Prism 8.4 (https://www.graphpad.com), exported as emf and arranged and labeled in Adobe Illustrator CC2020 (https://www.adobe.com/de), and exported to TIFF format.

