Figure 5.
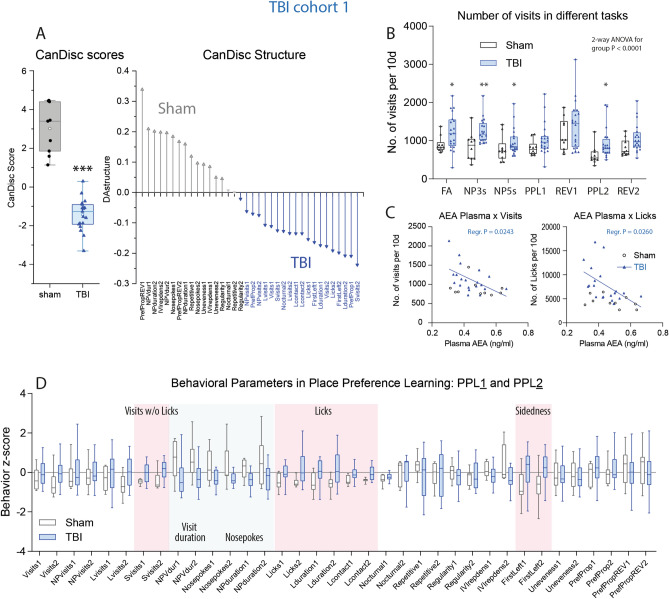
Canonical discriminant analyses of IntelliCage parameters, activity readouts in different tasks and behavioral z scores during place preference learning and reversal learning. (A) Canonical discriminant analysis score plot and structure. DA factor 1 explained 100% of the variance. The box shows the interquartile range, the line is the median, and the whiskers show minimum to maximum, each scatter is a mouse, the circle shows the mean. (B) Box/scatter plots of visits in different tasks normalized to periods of 10 days for each task. Each scatter is a mouse. n = 10 sham, n = 21 TBI; each two mice with incomplete data were excluded from the analysis. Data were compared with 2-way ANOVA for "group" × "task" and subsequent t test for group. *P < 0.05, **P < 0.01. Task abbreviations as in Fig. 4 and Table 1. (C) Linear association of the individual's average numbers of visits/10 day-periods and licks/10d versus the individual's plasma anandamide (AEA) concentration in the final blood sample. (D) Box plots of the z scores of behavioral parameters in PPL1/Rev1 and PPL2/Rev2. Parameters with "1" indicate PPL1/Rev1, "2" refers to PPL2/Rev2. Parameters, which were significantly increased in TBI mice, are highlighted in red, decreased parameters in blue (2-way ANOVA for "group", subsequent T-test for each parameter using an adjustment of P according to Šidák, P < 0.05, n = 10 sham, n = 21 TBI). Behavioral parameters and abbreviations are explained in Table 2. Behavioral data were analyzed in IntelliCage Plus software 2019 and FlowR 2017 (XBehavior; https://www.xbehavior.com), exported as tab-separated txt files, imported in Microsoft Excel 2016, and Graphs were created with Graphpad Prism 8.4 (https://www.graphpad.com) and exported as emf. Linear regression analysis (C) was done with Graphpad Prism. Graphs were arranged and labeled in Adobe Illustrator CC2020 (https://www.adobe.com/de), and exported to TIFF format.

