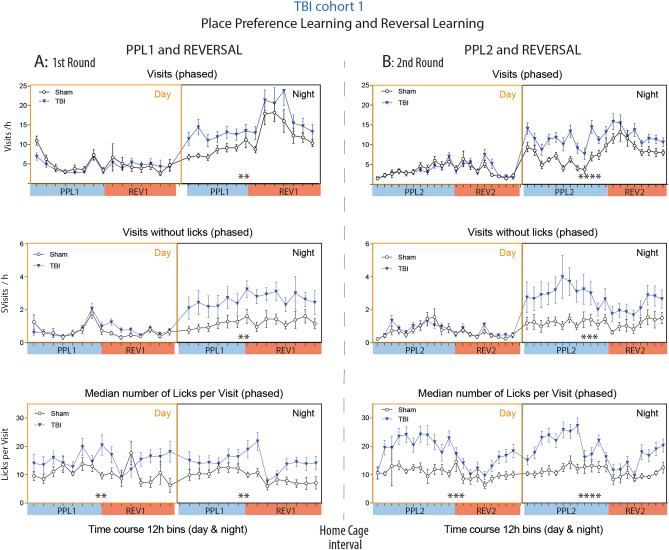
Figure 6.
Phased activity of TBI versus sham mice in IntelliCages. (A,B) Time courses of corner Visits/h, Visits without Licks/h (SVisits) and Lickings per Visit in TBI/sham cohort-1 during the first (A) and second round (B) of place preference learning (PPL1, PPL2) and the respective reversal learning tasks (REV1, REV2), respectively. The data show the mean ± SEM of n = 10 sham and n = 21 TBI mice. One and two animals respectively dropped out during PPL1 or REV1 because of general health problems. SVisits are visits without attempt (nosepoke) to get reward. Asterisks above the X-axis indicate significant differences of the areas under the curve between groups as assessed by 2-way ANOVAs with the factors "group" and "time" (day or night), *P < 0.05, **P < 0.01, ***P < 0.001. Data were analyzed in IntelliCage Plus software 2019 and FlowR 2017 (XBehavior; https://www.xbehavior.com), exported as tab-separated txt files, imported in Microsoft Excel 2016, and Graphs were created with Graphpad Prism 8.4 (https://www.graphpad.com) and exported as emf. Graphs were arranged and labeled in Adobe Illustrator CC2020 (https://www.adobe.com/de), and exported to TIFF format.

