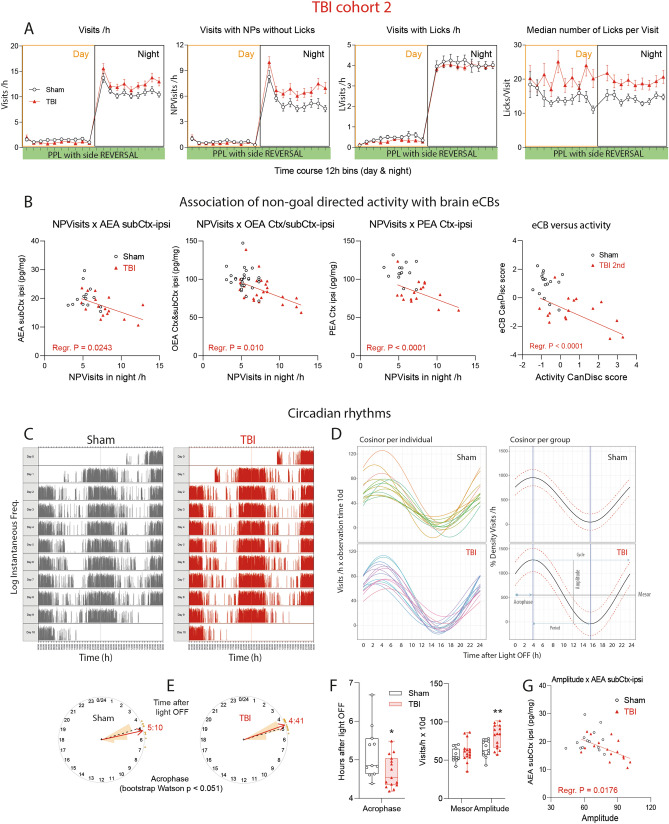
Figure 7.
Phased behavior and circadian rhythms of TBI versus sham mice in TBI/sham cohort-2. (A) In analogy to Fig. 5 time courses of corner Visits/h, Visits with NPs without Licks/h (NPVisits), Visits with Licks (LVisits) and Lickings per Visit in TBI/sham cohort-2 during place preference learning (PPL) and reversal learning tasks (REV), with LED-based based decision making of the right side in the correct corner. Samples sizes were n = 15 per group. (B) Linear associations of the nighttime non-goal directed activity (NPVisits/h = visits with nosepokes but without licks per hour) versus endocannabinoid concentrations in the ipsilateral brain in cohort-2 and linear association of CanDisc scores for eCBs versus CanDisc scores of activity. Each dot is a mouse. For TBI mice, the slopes of the linear regression lines differed significantly from "zero" (no association for sham mice, P values given in the figure), i.e. hyperactivity was associated with low eCB. Ctx cortex perilesional, subCtx subcortical. (C) Exemplary actogram showing the circadian rhythms of corner visiting activity in TBI/sham mice of cohort-2 during place preference learning. The Y-axes show the logarithms of the instantaneous frequency, which is the reciprocal of the time from start of one visit to start of next visit. Analogous circadian data of cohort-1 in Supplementary Figure S2. (D) Cosinor analysis of visiting activity of individual mice and the groups. The circadian parameters are shown in the bottom right graph. The red dotted lines show the 95% CI. (E) Circular presentation of the acrophases i.e. the time from Light OFF to maximum activity. (F) Quantitative and statistical comparison of major circadian parameters, acrophase, mesor and amplitude, as graphically depicted in (C) Box plots shows the interquartile range, the line is the median, the whiskers show minimum to maximum, dots are individual mice. Asterisks indicate significant differences between groups (2-sided, unpaired t tests; *P < 0.05, **P < 0.01, n = 15). (G) Linear association of the circadian amplitude versus AEA concentration in the ipsilateral brain underneath the lesion (subCtx ipsi). For TBI mice, the slope of the line differed significantly from "zero" (no association for sham mice). High amplitude was associated with low AEA. Data were analyzed with IntelliCage Plus software 2019 and FlowR 2017 (XBehavior; https://www.xbehavior.com), and images in (C–E) were exported from FlowR as .png, and actograms in (C) were colored to fit the groups (grey and red) in Adobe Photoshop CC2020. exported as tab-separated txt files, imported in Microsoft Excel 2016, and Graphs were created with Graphpad Prism 8.4 (https://www.graphpad.com) and exported as emf. Linear regression analyses (B,G) were done in Graphpad Prism. Graphs were arranged and labeled in Adobe Illustrator CC2020 (https://www.adobe.com/de), and exported to TIFF format.

