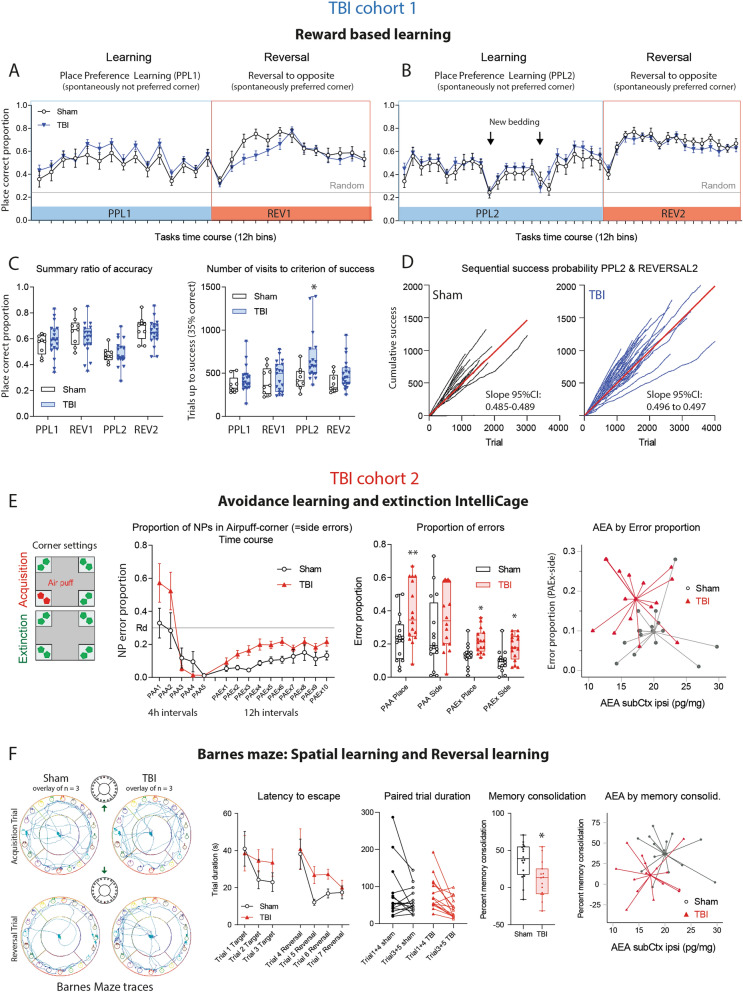
Figure 8.
Learning and memory of TBI versus sham mice in reward- and avoidance-based tasks. (A,B) Time courses of the proportion of correct corner visits during place preference learning and reversal learning tasks in TBI/sham cohort-1. During the learning period (PPL1, PPL2) mice had to prefer a spontaneously infrequently used corner (more difficult), the Reversal (REV1, REV2) switched the rewarding corner to the opposite side to a spontaneously preferred corner. The expected random correctness is 0.25. The time courses did not differ between groups (2-way ANOVA). The samples sizes were n = 10 sham, n = 21 TBI. One and two animals respectively dropped out during PPL1 or REV1 because of general health problems. (C) Box/scatter plots showing the individual's mean proportion of correctness and number of trials needed to reach the criterion of success during the place preference learning (PPL1, PLL2) and reversal learning (REV1, REV2) tasks of TBI/sham mice of cohort-1. Sample sizes as in (A,B). The box shows the interquartile range, the line is the median, the whiskers show minimum to maximum, dots are individual mice. During PPL2, olfactory cues were removed twice by changing the bedding material (time points indicated in B). Correctness dropped similarly in both groups, but TBI mice needed more trials to success during this period. The criterion of success was 35% correctness, i.e. 10% above random. Data were compared with 2-way ANOVA with the factors "group" and "task" and subsequent posthoc t test for each task using an adjustment of alpha according to Šidák, *P < 0.05. (D) Sequential success probability plots exemplarily shown for PPL2/REV2. The cumulative correct responses plotted versus trial number for each animal, and the steepness of the linear regression line (red) shows the learning velocity. The 95% confidence intervals did not overlap, suggesting faster learning of sham mice during this period in agreement with 2C. The plot reveals the hyperactivity of TBI mice. (E) Place avoidance acquisition (PAA) and extinction (PAEx) in TBI/sham cohort-2 using an airpuff punishment in one corner on both sides during acquisition, followed by a 24 h home cage interval, and no reinforcement during extinction except LED reminder (illustration left). Time courses show the means and SEM of n = 15 mice per group. The box/scatter plots show the individuals' mean proportion of place and side errors during the PAA and PAEx periods. "Place error" is a visit to the forbidden corner, and "Side error" is a nosepoke in the forbidden corner. Data were compared with 2-way ANOVA with the factors "group" and "task" and subsequent posthoc t test for each task using an adjustment of alpha according to Šidák, *P < 0.05, **P < 0.01. The right XY-scatter plot with centroid spikes shows the group separation based on AEA in subcortical ipsilateral brain tissue (AEA subCtx ipsi) versus side errors during extinction. There was no association of AEA by errors. (F) Barnes maze path tracks and learning behavior in TBI/sham cohort-2, late after surgery (5–6 months, n = 16 sham, n = 15 TBI). The left shows the superposition of path tracks of each three mice of the first learning trial and first reversal trial. The time courses of the latency to escape were similar at baseline and dropped in both groups, but dropped faster in sham mice than TBI mice. Hence, memory consolidation defined as percentage change of the escape latency of learnt trials (Trial 3, 5, 6) versus baseline trials (Trial 1, 4) was lower in TBI mice (2-sided unpaired t test, *P < 0.05). The right XY-scatter plot with centroid spikes shows the group separation based on AEA in subcortical ipsilateral brain tissue (AEA subCtx ipsi) versus memory consolidation. There was no association of AEA by memory consolidation. Data in (A–E) were analyzed with IntelliCage Plus software 2019 and FlowR 2017 (XBehavior; https://www.xbehavior.com/), exported as tab-separated txt files, imported in Microsoft Excel 2016, and Graphs were created with Graphpad Prism 8.4 (https://www.graphpad.com) and exported as emf. Barnes Maze behavior was analyzed with EthoVision XT (https://www.noldus.com) and exported to Excel. Spiked scatter plots in (E,F) were created in SPSS 25 (https://www.ibm.com/de) and exported as emf. Graphs were arranged and labeled in Adobe Illustrator CC2020 (https://www.adobe.com/de), and exported to TIFF format.

