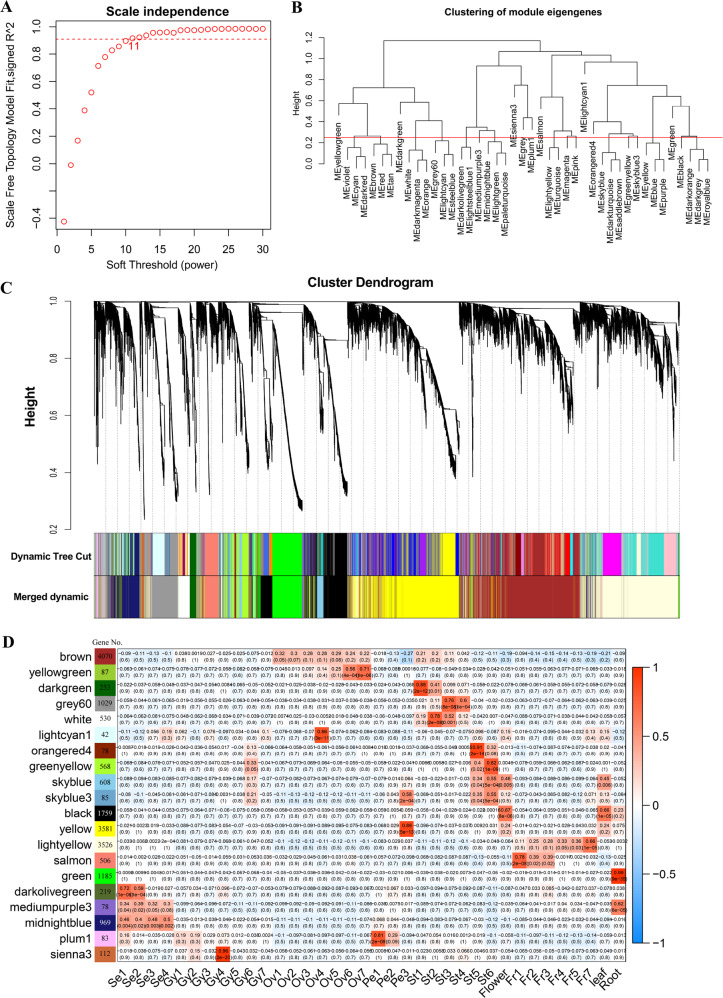
Fig. 2. Weighted gene co-expression network analysis for pineapple RNA-seq data.
a Analysis of network topology for different soft‐thresholding powers. The graph displays the influence of soft‐thresholding power (x‐axis) on the scale‐free fit index (y‐axis). b Cluster dendrogram of module eigengenes. Branches of the dendrogram group together eigengenes that are positively correlated. The red line is the merging threshold, and groups of eigengenes below the threshold represent modules whose expression profiles should be merged due to their similarity. c Hierarchical cluster dendrogram showing co-expressed modules identified by weighted gene co-expression network analysis for the pineapple RNA-seq data. Each leaf on the tree represents one gene. The major tree branches constitute 20 merged modules (based on a threshold of 0.25), labeled with different colors. d Module-tissue association analysis. Each row corresponds to a module, with the number of genes in the module indicated on the left. Each column corresponds to a specific tissue. The correlation coefficient between a given module and tissue type is indicated by the color of the cell at the row-column intersection. Red and blue indicate positive and negative correlation, respectively.

