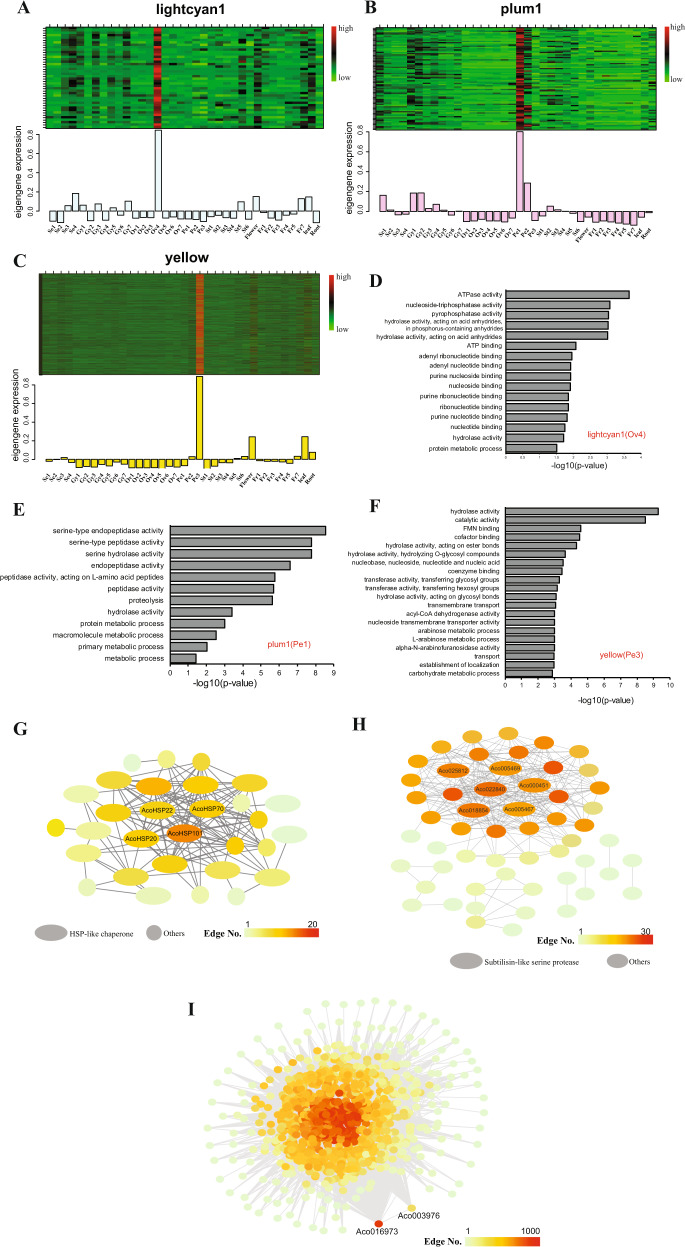
Fig. 3. Genes, enriched GO terms and networks of the Ovule 4-, Petal 1-, and Petal 3-specific modules.
a Eigengene expression profile for the Ovule 4 (lightcyan1) module in different samples. Top panel: expression heatmap showing the relative FPKM of all genes from the Ovule 4 (lightcyan1) module. Bottom panel: the x-axis indicates the samples, and the y-axis indicates the log2 “relative FPKM values” of the module eigengene. b Eigengene expression profile for the Petal 1 (plum1) module in different samples. c Eigengene expression profile for the Petal 3 (yellow) module in different samples. d Enriched GO terms for the Ovule 4 (lightcyan1) module. e Enriched GO terms for the Petal 1 (plum1) module. f Enriched GO terms for the Petal 3 (yellow) module. g The correlation network of the Ovule 4 (lightcyan1) module. Thirty genes with edge weights greater than 0.3 were included in the Cytoscape-generated diagram; oval shapes were used to indicate the 19 heat shock protein genes. h The correlation network of the Petal 1 (plum1) module. Fifty-four genes with edge weights greater than 0.3 were included in the Cytoscape-generated diagram; the ovals indicate the six subtilisin-like serine protease family genes. i The correlation network of the Petal 3 (yellow) module. The Cytoscape-generated diagram includes 1031 genes with edge weights greater than 0.4.

