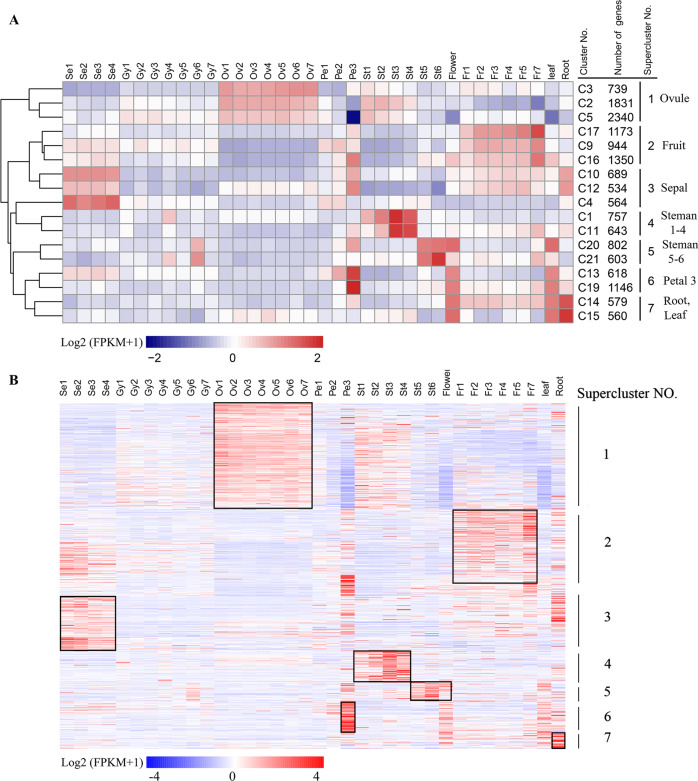
Fig. 4. Seven superclusters of genes with unique tissue- or stage-specific expression profiles.
a Seventeen of the 21 K-means clusters included 15,872 genes with distinct stage- or tissue-specific expression patterns. The scale represents the Log2(FPKM + 1) values of all genes in a given cluster. Clusters with similar expression trends were combined to form seven superclusters. b Heatmap of the Log2(FPKM + 1) values of 918 individual transcription factor (TF) genes. The black boxes show the high expression TFs in each Supercluster.

