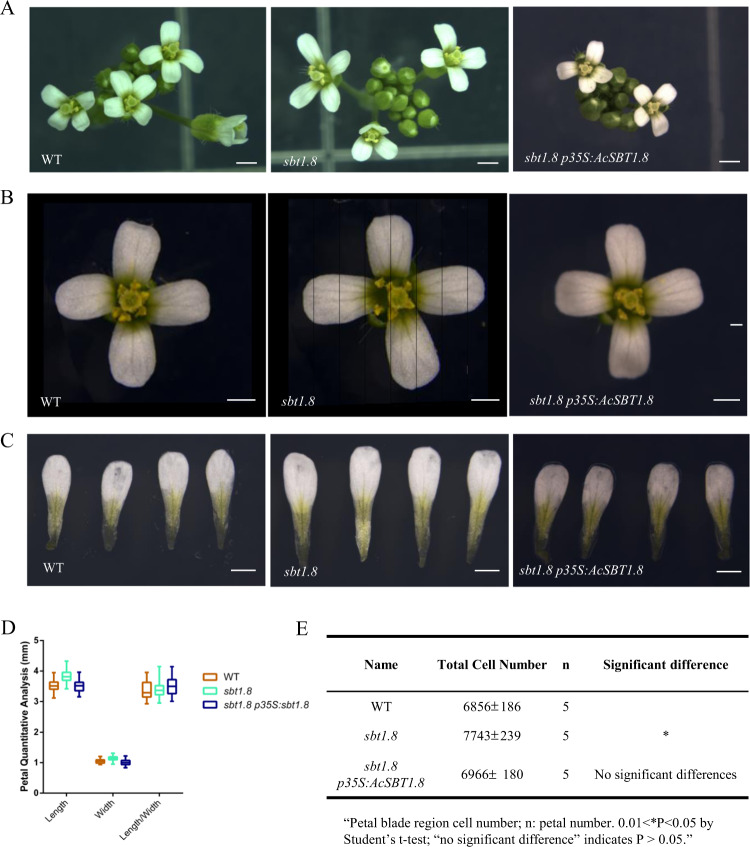
Fig. 7. Petal phenotype analysis of the sbt1.8 mutant and the complementation lines.
a–c Inflorescence, flower and petal phenotypes of wild type (WT), sbt1.8 and the sbt1.8 p35S:AcSBT1.8 complementation lines at floral development stage 14. Bar = 1 mm. d Quantitative analysis of petal size in WT, sbt1.8 and the complementation line. Values are given as the mean ± SD of 34 petals (n = 34) from independent plants (**P < 0.05 by Student’s t test). e Cell number in the petal blade region. Values are given as the mean ± SD of 5 (n = 5) petals from independent plants (0.01 < *P < 0.05 by Student’s t test; “no significant difference” indicates P > 0.05).

